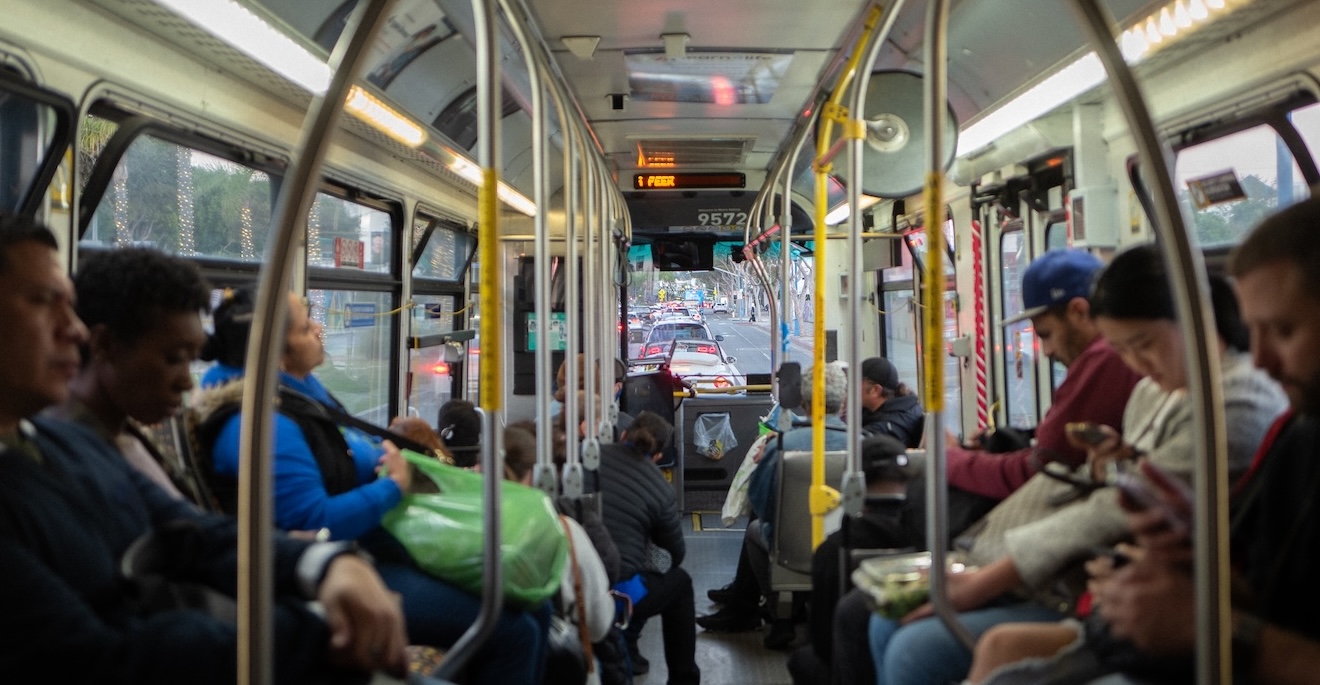
Bus riders stuck on the 4. Image by Gabe Gaurano
Bus riders in LA are delayed more than 5 million minutes every weekday
Table of Contents
In a new analysis, the Streets for All Data/Dev team has found that on the average weekday LA Metro bus riders are delayed by 5,538,500 minutes — or more than ten years of lost time per day.
The bus system is the backbone of LA’s transit network, with many individual bus lines moving more people than some of our dedicated rail or BRT (Bus Rapid Transit) lines. Despite massive ridership, these routes largely lack any sort of dedicated lane or tactical improvement to speed up service.
Hundreds of thousands of passengers waste hours in the same traffic as private vehicles each day — a failure in planning efficient streets and failure of equitable mobility.
In LA 89% of bus riders have a median household income less than $50k and 78% do not have access to a car. Often, the bus is a mobility lifeline for riders. At the same time, it’s clear existing service quality does not incentivize riders who otherwise could afford alternative modes. Bus riders in LA are at the forefront of advancing the region’s climate and congestion goals, reducing air pollution and reducing cars on the road. But in turn our road design rewards them with slow, delayed, and unreliable trips.
Map of weekday bus delay by rider minutes by segment
Our analysis defines delay as the difference between when a bus is reliably fastest (often early in the morning) and the average bus speed across the parts of the day when most people ride (7AM-8PM). This delay is then multiplied by the average number of riders over a given segment to return total rider minutes delayed in a specific section of street.
For example, between Washington and Venice along Western Ave our analysis found 2,700 riders travel northbound on the average weekday. Without congestion, the bus averages 15.5 mph but during the middle of the day it slows to less than 9mph. Over this less than half mile segment of street the bus slows by nearly 2 minutes. That turns into 4,800 minutes of rider delay per weekday.
Speeding up buses also creates more efficient service, allowing the same frequency of bus service with fewer buses and drivers. Not only would speed improvements mean faster trips for riders, but increased frequency at the same cost to Metro.
5% of lane miles are responsible for 30% of delays
While many streets see some rider delay, there are clear hotspots with both high congestion and high ridership. These are the areas that would benefit the most from transit improvements - allowing buses to move more reliably and significantly increasing the throughput of the street
This map shows our analysis of the worst street segments in Los Angeles on a rider delay basis. (Our definition of segments are that they are at least a mile long and are in the worst 10% for rider delay per mile).
Map of top percentile segments by rider delay minutes
183 lane miles, or about 5% of Metro’s routes, make up 30% (1.80 million minutes) of the region’s daily delay.
For example, Los Feliz Blvd between Vermont Ave and Griffith Park Blvd, served by the 180 and 217 routes, is made up by four segments totaling just over a mile and cumulatively sees 9,729 minutes of rider delay daily. The same section in the opposite direction generates just 2,280 minutes of rider delay daily. These two sections of the network are the same length and served by the same routes but one generates over four times the delay to riders.
The total rider delay across the network is clearly disproportionately driven by a specific set of major transportation corridors. This means that we have sections of our transportation that are drastically underperforming compared to the high demand for reliable mobility through them, but it also means that total system throughput can be significantly increased by improving a relatively small section of the network.
Implementation of dedicated bus lanes and signal priority in high impact segments can yield the highest return on transportation investment.
Where are bus lanes planned and where are they most needed?
Looking at the 90th percentile of rider delay per mile many of the highlighted corridors will not come as a surprise. For example, Vermont and Wilshire Boulevards jump out as many riders face significant delays. Some of these streets have worked their way into planned projects, while others need prioritization or improvements.
Vermont, Broadway, and Venice are all prioritized for the 2028 Olympics and will hopefully receive 24/7 bus lanes within the next 3 years. Similarly, Sunset Blvd, Florence Blvd, and Olympic Blvd will likely be reconfigured with peak hour bus lanes in the next year or two.
System wide, all-door boarding will lead to significant dwell time reductions on all routes and the bus lane enforcement program should improve the efficacy of transit-only lanes. These are planned to go in within the next few months and will speed up buses across the region.
Our analysis also shows where existing lanes may not be doing enough. Wilshire Blvd, despite largely having peak hour bus lanes, has cumulatively over 300,000 minutes of daily rider delay. D Line construction is likely a contributor - but heavy ridership, gridlock, and limited peak hour lanes all severely limit the line’s effectiveness.
Projects we recommend prioritizing short term based on the delay analysis:
| Street | Treatment |
|---|---|
| Wilshire Blvd | Upgrade peak hour bus lanes to 24/7 |
| Santa Monica Blvd | Add bus lanes |
| Western Ave | Add bus lanes |
| Alvarado in Westlake | Upgrade peak hour to 24/7 and extend to Hoover |
| 5th/6th Street in DTLA | Upgrade peak hour to 24/7 |
| Slauson and Pacific | Add bus lanes in Huntington Park |
| 3rd Street | Add bus lanes |
| Van Nuys | Add bus lanes for duration of light rail construction |
Other segments on the 90th percentile list should receive tactical improvements or bus lanes where possible. All told, improvements to just these 183 lane miles of improvements could reduce the daily delay of bus riders by nearly 1/3rd and save Angelenos a collective 28,300 hours each weekday.
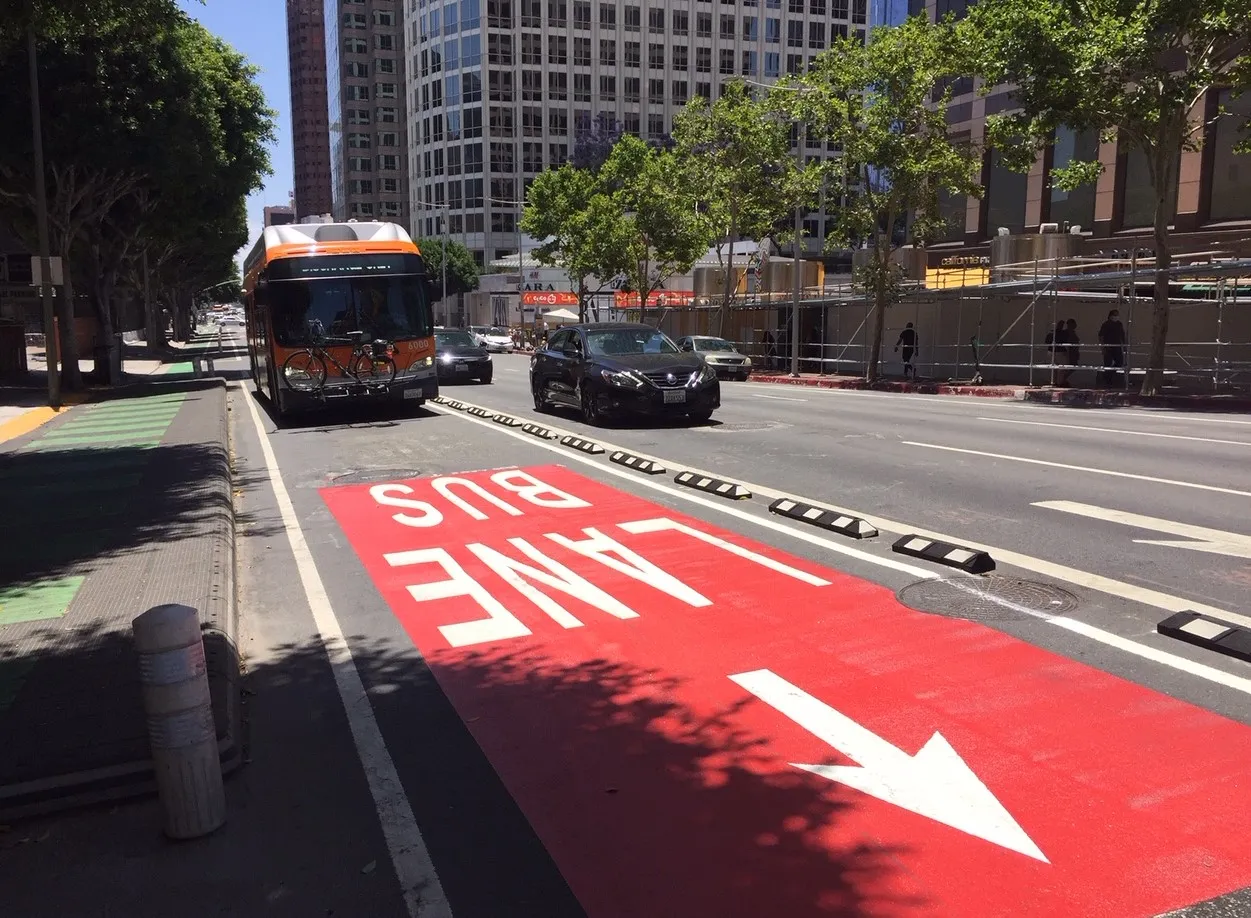
Bus lane on Figueroa in DTLA. Image by Joe Linton at Streetsblog LA.
Limitations and Future Research
It’s important to acknowledge that there are other reasons to support bus lanes that our analysis does not address. Bus reliability is a significant indicator of a route’s health both for operating a line effectively and for riders trying to plan trips. A segment may not show serious delay but may have significant volatility in consistency which could be solved with a bus lane. Similarly, bus bunching and passenger crowding may influence bus lane consideration.
Although LA Metro operates the majority of bus service in LA County - with over 40 other bus operators (including Big Blue Bus, Dash, and Long Beach Transit) there are many additional streets where significant numbers of riders also suffer from congestion hotspots. This is worth further research but may need to be done by individual agencies or a parent body like SCAG, Metro, or Caltrans as aggregating ridership data across agencies is difficult.
We may continue this research further in the future. One idea is using our dataset to predict how many service hours could be recovered by adding a bus lane to a street that sees significant delay. This is an efficiency gain for transit operator budgets and logistics, allowing for more bus frequency with the same amount of driver time.
Our street segment calculation could also be modified to study how effective bus lanes in LA are against adjacent sections of street that do not have dedicated lanes for transit. Similarly, we could score sections of LA Metro rail lines by rider delay (although these hotspots are likely few and already known to Metro and riders alike).
Methodology
If you are interested in exploring the code, the datasets are in a Github repo along with a single jupyter notebook file for re-running our calculations.
This analysis is based on accessible, transparent methods for calculating delay impacts to riders across the entire LA Metro bus network. The ultimate goal is to produce a dataset describing, for every physical section of street that is covered by an LA Metro bus, how much time bus riders lose on that section of the street due to buses sitting in traffic. This is reflected in the calculated metric of ‘Total Segment Rider-Minutes Lost’, which is the number of minutes lost due to the bus delay on that segment, defined as a portion of a route between two stops, multiplied by the segment’s average number of riders, then summed across the different bus routes that serve that segment. This dataset can then be used as an input for valuable secondary analysis of the bus network. In this work, we use it for identifying potentially high impact bus corridors for network improvements.
The starting point is CalTrans’s Cal-ITP California Transit Speed map project, which publishes data describing the speed of transit vehicles across a transit network for every route at every segment. In addition to the segment geometry and basic descriptive information, this dataset features the 20th, 50th, and 80th percentile speeds at the different times of day that the bus routes operate. By comparing the 50th percentile speeds with the 80th percentile speeds for a segment, we calculate the number of minutes lost to riders on this segment due to delay. Next, using ridership data featuring the average number of people who get on and off the bus at every stop, we can calculate the average ridership on that segment of a bus route. The number of riders is multiplied by the minutes lost and then totalled across the buses operating on that segment to produce the ‘Total Segment Rider-Minutes Lost’. Finally, as an application of this initial analysis, we apply a grouping methodology to identify significant “corridors” of adjacent sequences along contiguous sections of street with high values of “Total Segment Rider-Minutes Lost” to inform advocacy efforts for network improvements.
The Caltrans’s Cal-ITP California Transit Speed data measured bus travel speeds at the 20th, 50th, and 80th percentiles for each segment of the network at the different service time periods throughout the day, defined as follows:
| Time of Day | Hours |
|---|---|
| Early AM | 04:00-07:00 |
| AM Peak | 07:00-10:00 |
| Midday | 10:00-15:00 |
| PM Peak | 15:00-20:00 |
| Evening | 20:00-24:00 |
| Owl | 00:00-04:00 |
The time lost due to delays is calculated based on the difference in time to travel the segment between the highest 80th percentile speed across all non-Owl time periods and average 50th percentile speed among the core transit time periods: AM Peak, PM Peak, and Midday. The 80th percentile chosen speed value is to represent a realistic and common best speed the bus travels on that segment given its specific conditions and parameters. The 50th percentile chosen speed should represent, very simply, the most common speed the bus travels on that segment during core service. Put simply, these speeds are respectively representing the best speed the bus actually travels in realistic conditions and the speed it most frequently travels. We avoid comparisons to unrealistically high speeds, such as the free flow or speed limit, and we choose a simple average of 50th percentile speeds to act as a baseline and to avoid biasing towards delay.
Some data cleaning and processing work was needed here to deal with duplicate values where there were multiple data points for a given segment at a specific time of day. Many of these duplicates hold dirty and/or useless speed data, such as numeric values being all zeroes, which are filtered out. For remaining duplicates, the rows with the largest difference between 80th and 50th percentile speed are selected. This solution was chosen after observing that many of the non-informative duplicates had the same values for both percentiles.
The next key input was reliable and accurate segment-level ridership for each bus route. Using data received from Metro through a public records request which described the average boardings and de-boardings on a daily basis for each stop for each bus route, we were able to iterate through the bus route sequentially in each direction and generate a proportional segment-level ridership curve for each bus route in the network.
The data also did not include values for the segments’ stop numbers along the route, since stop sequence is not consistent for every route at all times of day and all types of service trip. In order to have usable sequence values we used a separate dataset, also received through Cal-ITP, to seed initial sequence values and then iteratively filled in missing values by matching adjacent stops to one another.
Since this input dataset featured average daily boardings and deboardings, the resulting curve does not represent the approximate ridership for each bus at any given segment in the network at any given time, but instead represents approximately how many riders traverse that segment on that bus route each weekday. Since the baseline and target speeds used to calculate time lost to delay are both determined for the entire day’s service instead of at individual times, the ridership and delay values are contextually commensurate.
Using the calculated values for route-segment-level time lost due to delay and approximate daily ridership, we can then simply multiply to calculate daily ridership-minutes lost due to delay. The final step is to procedurally and intelligently merge the route-segments so that the delay can be viewed across the network’s geometry instead of separated by route. We merged through combining segments that met an 80% threshold of overlap.
Those overlapping segments are first prepared for the merging algorithm by extrapolating the line segments in the dataset into polygons and shortening them to prevent extraneous overlap at the ends. Next, pairs of segments are inspected for their overlap and, if the threshold is met, their geometry is merged and the features are updated, either concatenated, aggregated, or otherwise, commensurate with the individual shape and type of each feature.
This merging procedure is performed for each direction of the network separately so that segments representing bus travel in opposite directions are not merged. This is done since segment improvements, such as a dedicated bus lane, can be installed in single travel direction.
Once the Total Segment Rider Minutes Lost is calculated for the entire network, we calculate additional key metrics such as Total Segment Rider Minutes Lost per Mile, which the original metric is normalized by distance. This full procedure results in a comprehensive segment-level analysis of the time lost to riders across the LA Metro bus network. This analysis is able to inform decision making and advocacy efforts for improving streetscapes, network operations optimization, and more.
Finally we present a specific application of this segment-level analysis by demonstrating a corridor identification procedure to inform advocacy for network improvements. The top segments by Total Segment Rider Minutes Lost per Mile, by a specified percentile, are selected and evaluated street-by-street for the entire network. Using a breadth-first-search, groups of sequential segments are assembled and, if their final total length exceeds one mile, the grouping is added as a corridor. For this analysis we used percentile values of 85, 90, and 95. The corridor identification process is an easily ingestible synthesis of the segment-level analysis that highlights the specific sections of the bus network where improvements would deliver the most value to riders.