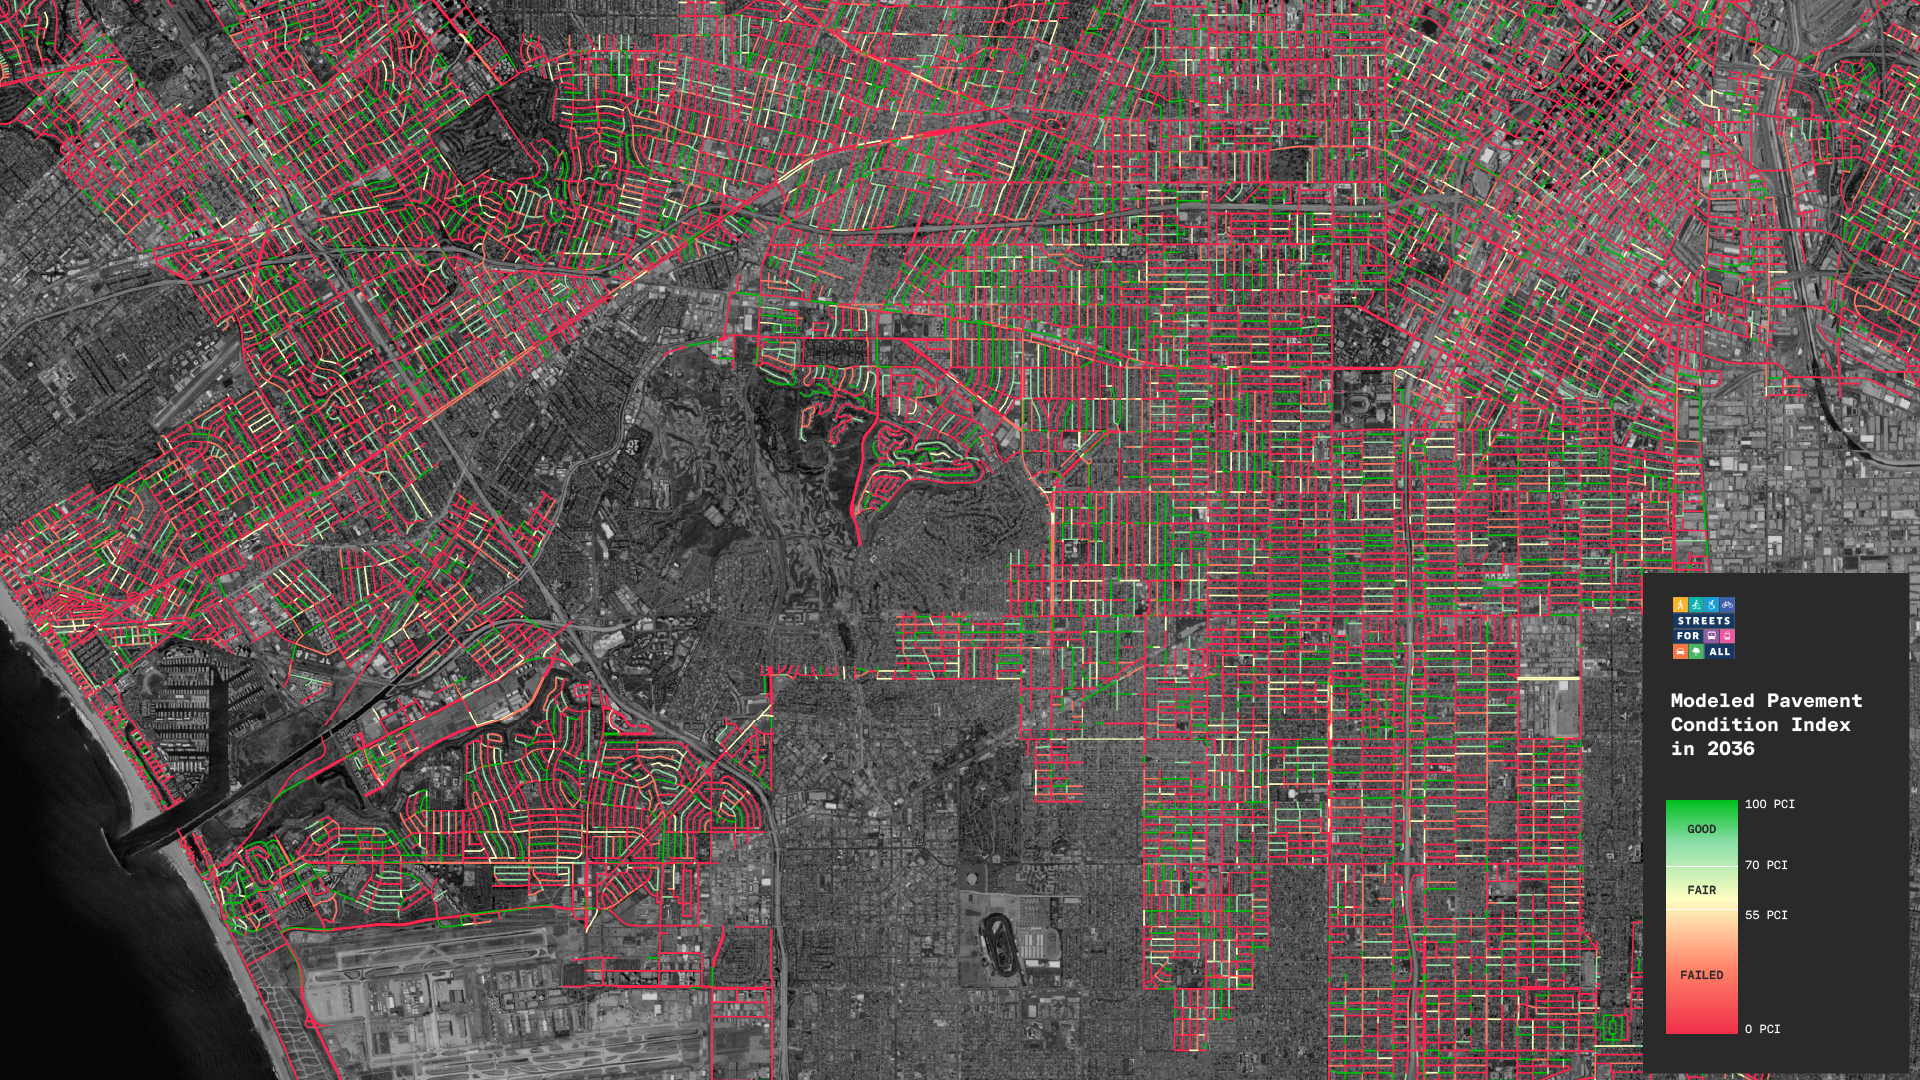
A map of the City Pavement Condition Index in 2036 under the current budget and repaving trends.
LA stopped repaving streets. We modeled how bad they are going to get
Table of Contents
The City of Los Angeles has the largest street network in the nation, with over 7,500 miles of roads. The Bureau of Street Services (referred to as BSS, and branded as StreetsLA), is the agency responsible for maintaining this sprawling network.
Unfortunately, we are standing at the edge of a fiscal cliff. Despite LA’s heavy car traffic, our streets receive less investment than peer cities (for example, about a third of what Long Beach spends per mile of road). Decades of BSS ignoring federal Americans with Disabilities Act (ADA) law has created a massive backlog of access ramps. Combined with a citywide budget crisis, lower staff capacity, and the compounding cost of repaving, Angeleno’s can expect LA’s overall street condition to get much worse.
Without a change in approach, LA’s current average Pavement Condition Index (PCI) of 71 is on track to fall to 47 by 2035. At that point a majority of streets in the City will be in a failed state and will cost $15 billion to fix.
- LA has a $8B street and access ramp maintenance backlog. We are on track for that growing to $15B by 2035.
- Large asphalt repair isn’t working. It is much more expensive per square foot compared to repaving, it produces no meaningful PCI gain, and will lead to almost $2 billion in additional deferred maintenance over the next decade.
- To maintain a state of good repair we estimate the Bureau of Street Services (BSS) requires a repaving budget of $350 million per year. The City has rarely budgeted half that.
- Because of historical underinvestment, access ramp costs are an outsized burden. At the current price of $50,000 per ramp it will cost around $4 billion to fix all the ramps in the City.
- Delaying fixing a street makes it exponentially more expensive for future taxpayers. Just a five year delay can increase repair costs 10x.
Our report shows LA needs to fully reimagine investments in the public realm. The City allowed BSS to ignore federal law and lawsuit settlements for decades and now close to 100,000 access ramps are likely out of compliance and must be fixed at exorbitant cost. The City has been so negligent on this front they do not even know how many access ramps need to be fixed.
In the last few years the City is finally adhering to federal law and making sure broken access ramps are fixed alongside fixing deteriorating streets. This functionally doubles costs and timelines for repaving. Instead of addressing the problem head on, BSS has chosen to again skirt ADA requirements. The bureau has stopped repaving almost entirely, instead using an expensive treatment they call ‘large asphalt repair’. These growing expenses compound the cost of repaving. Each delay to fixing a street makes it more expensive for future taxpayers. The City is patching problems but unable to fix structural deficiencies. There is no path without a multi-billion dollar investment that can maintain the current street quality.
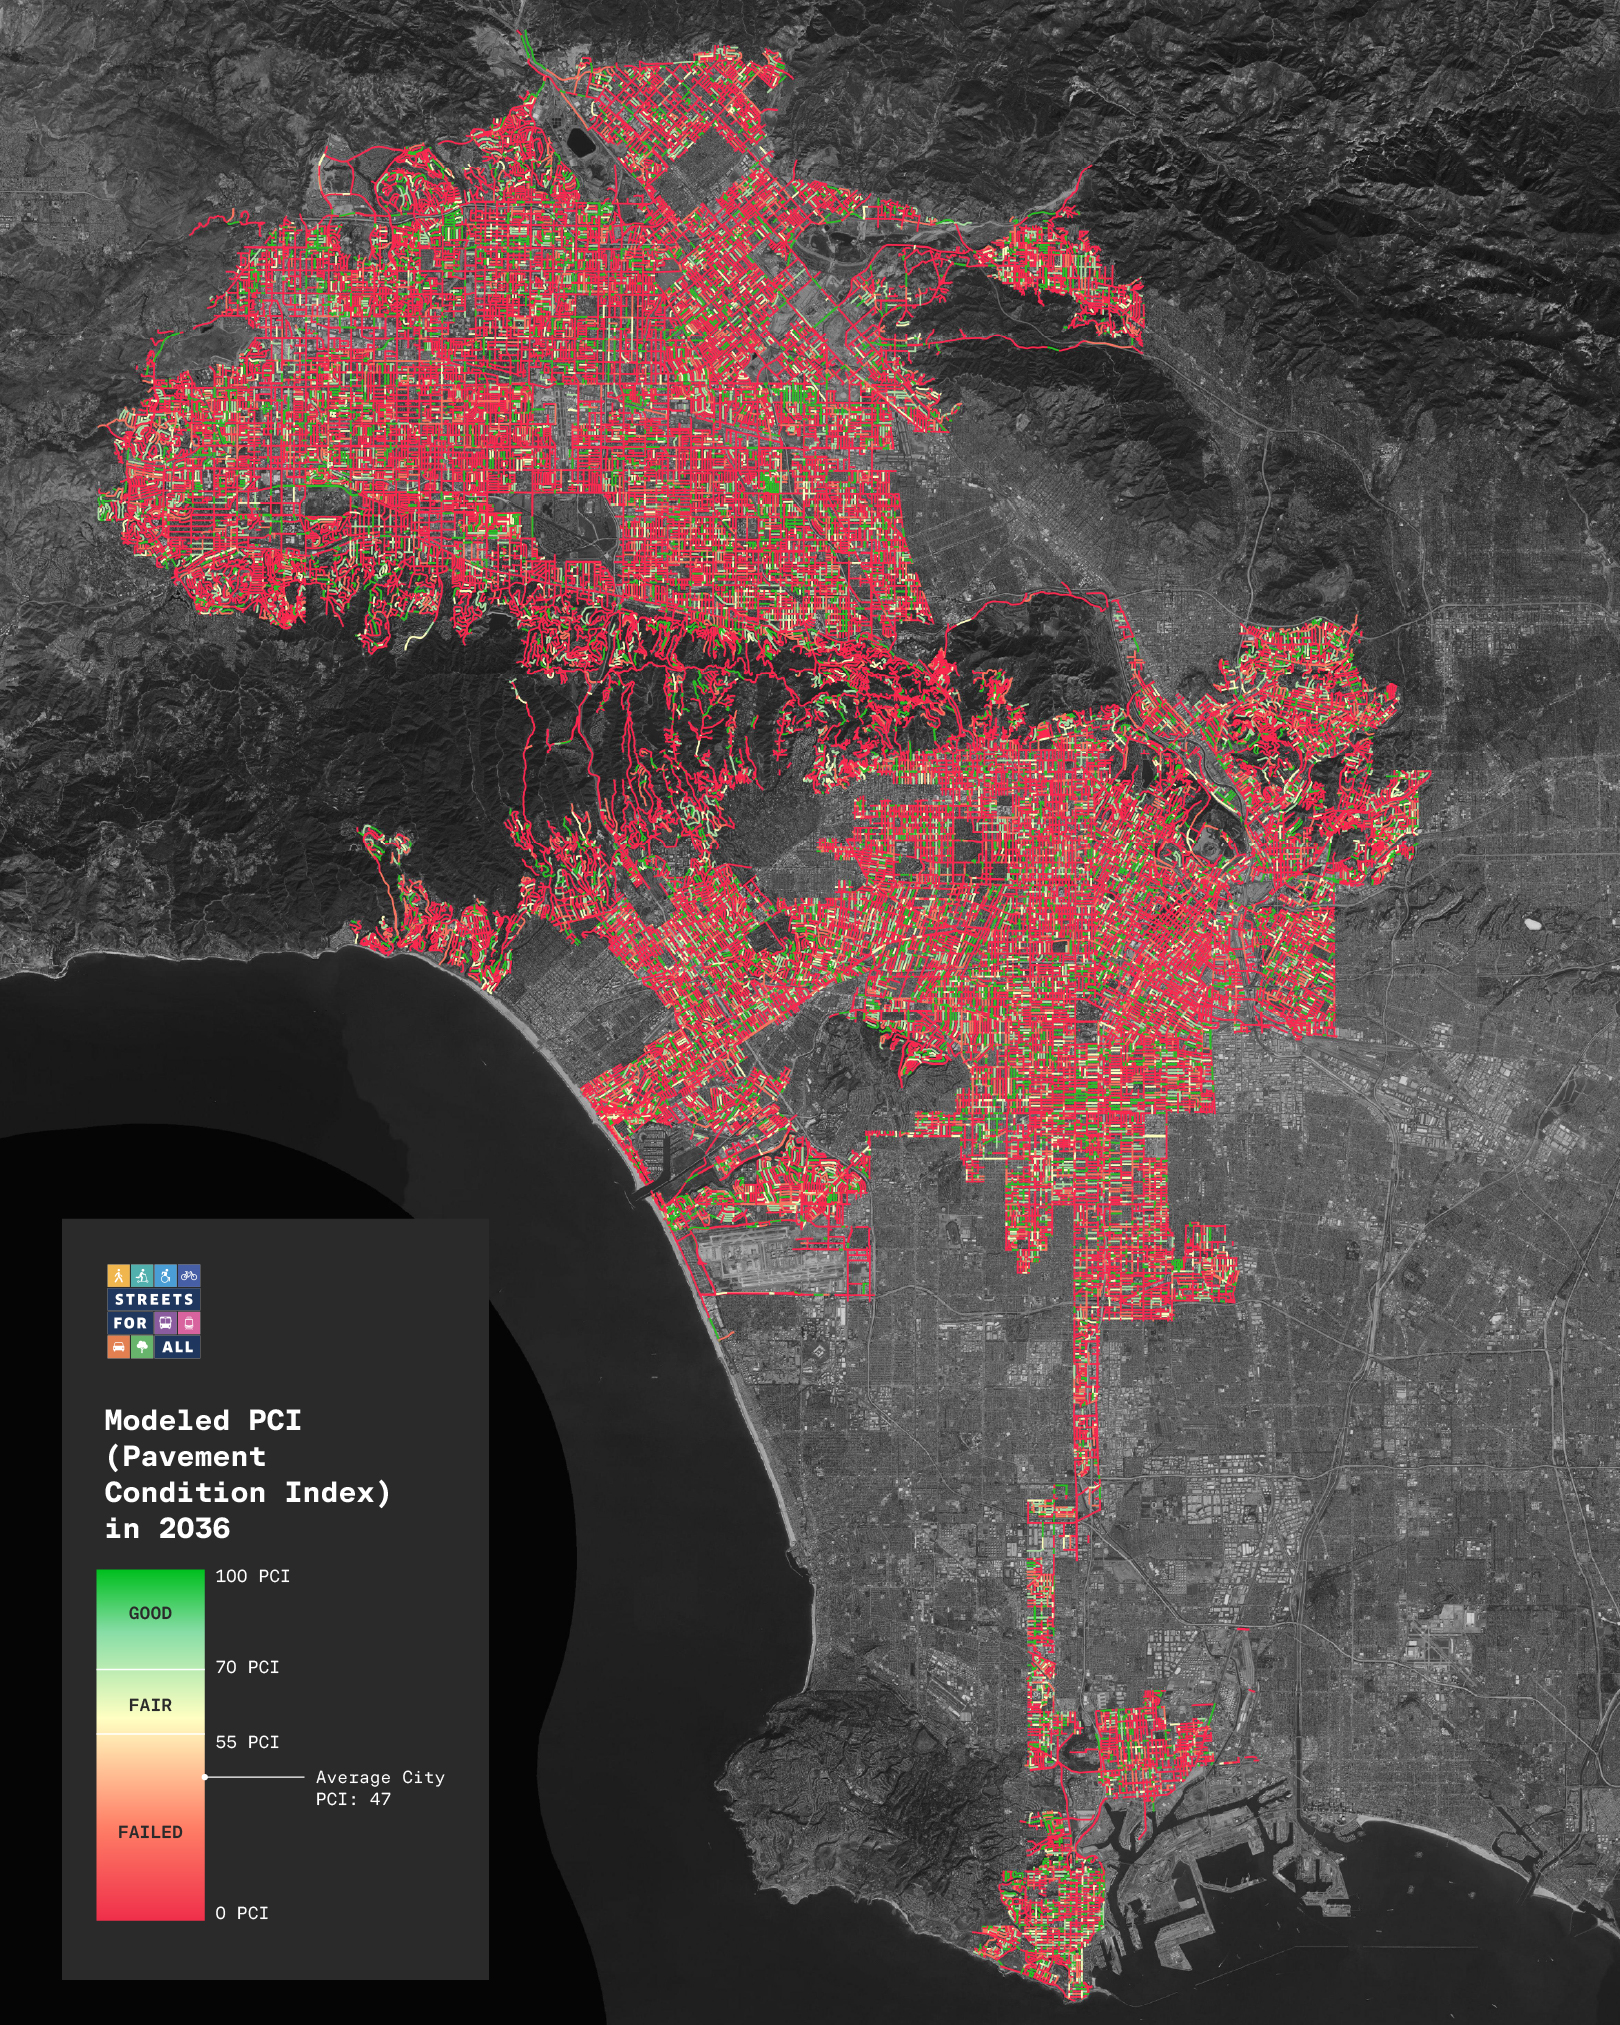
This map shows the City in 2036 with the current trends of Large Asphalt Repair and a limited budget of 120,000,000. The average PCI is 47, a majority of streets are failed, and there is $15 billion in necessary street maintenance.
A road in decent condition can be slurry-sealed at $30,000 per lane mile. If that maintenance is ignored long enough, the street must be repaved and costs rise nearly tenfold to $250,000 per lane mile. As the street deteriorates further, it must instead be rebuilt from the subsurface up, costing over $500,000 per lane mile. We are on track for a majority of LA streets to fall into that last most expensive repair option.
This is all exacerbated by the current budget crisis and City spending priorities. For example, if the $2.6 billion the City is bonding to upgrade the Convention Center was instead prioritized for street repair over the same timeframe (2025-28), our model suggests that by the Olympics LA would have a PCI of 77, and almost a quarter of the City’s access ramps would be fully ADA-compliant. In addition, we would have prevented over $7 billion in deferred maintenance costs by the end of the decade.
City officials face difficult decisions going forward. Should LA continue to prioritize pavement quality over street safety and accessibility? What are strategies to reduce the burden of repaving costs? What additional funding sources can be leveraged?
To help policymakers and the public understand the coming fiscal crisis, we’ve built a tool to show different repaving scenarios over the next decade. If you are unfamiliar with some of these terms, we describe them below.
Repaving Scenarios
To help policymakers and the public understand the coming fiscal crisis, we’ve built a tool to show different repaving scenarios over the next decade. If you are unfamiliar with some of these terms, we describe them in the next section.
Pavement Condition Index (PCI)
A 0-100 score of pavement quality
Lane Mile
This is a standard measurement for street maintenance and represents a mile of a single traffic lane. Repaving a mile of a four lane road would mean repaving four lane miles.
Deferred Maintenance
This is the estimated outstanding cost to keep things in a state of good repair. For street repaving, this is how much the City of Los Angeles would need to spend for every street to have a minimum PCI of 70, or what BSS considers a ‘good’ condition.
Slurry Seal
A surface coating applied to roads with low-to-moderate wear to help them last longer. BSS estimates these treatments add 3-7 years of life to a road bed.
Large Asphalt Repair
A term used by Los Angeles’ Bureau of Street Services to describe repaving part but not all of a road in order to avoid legal requirements triggered by road repaving.
Pavement Condition Index, a ticking fiscal bomb
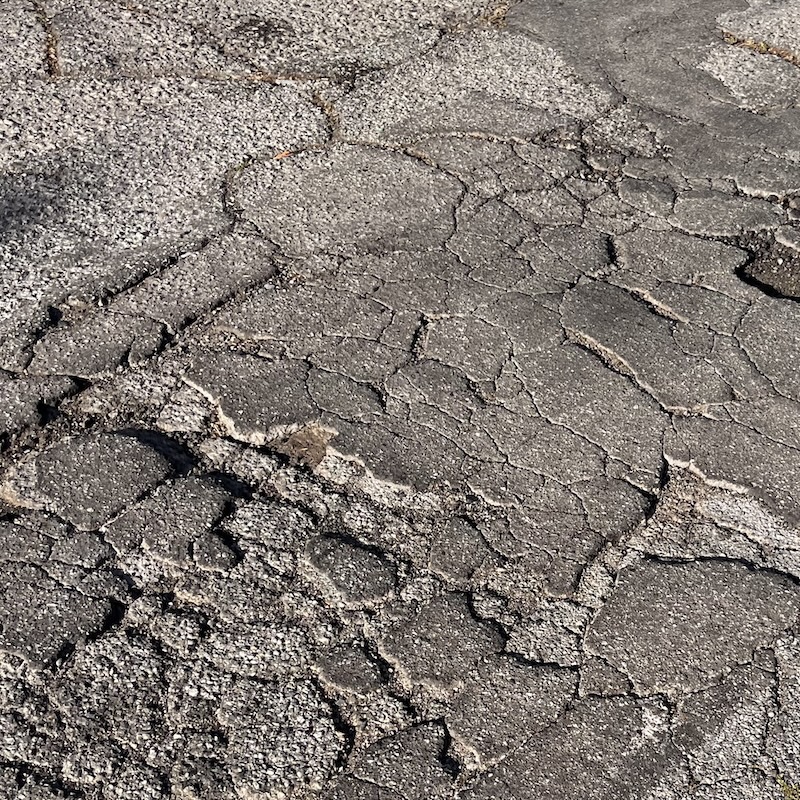
Street maintenance is a core municipal responsibility, and a regular compass heading for the average Angeleno’s understanding of “how well is the City meeting my needs”. Potholes and broken streets are visible and tangible, leading to broken vehicles, erratic driving, and a feeling of underinvestment.
While repaving streets seems simple, it is complicated and in many ways counterintuitive. Recently in Los Angeles, various stressors have led to policy changes making it even more expensive and challenging. We are going to give a brief overview here.
| PCI | 71–100 |
| Treatment | Slurry Seal |
| Cost | $30k / lane mile |
| PCI | 56–70 |
| Treatment | Resurfacing |
| Cost | $190k / lane mile |
| PCI | 0–55 |
| Treatment | Reconstruction |
| Cost | $250k–$500k / lane mile |
There are two mental models to build for understanding repaving. First, as a street ages it gets more expensive to fix. Second, the rate of deterioration is non-linear. Pavement Condition Index (PCI) is a 0-100 score to assess the structural integrity of a road. Anything above 70 is considered in good condition. Anything below 55 is considered failing. Based on conversations with BSS staff these are rough costs per lane mile for different kinds of repaving:
| Repaving Type | Applicable PCI | Avg Cost per Lane Mile | Access Ramp Upgrades Triggered |
|---|---|---|---|
| Slurry Seal | >71 | $30,000 | No |
| Large Asphalt Repair | 41-70 | $395,000 | No |
| Resurfacing | 41-70 | $190,000 | Yes |
| Reconstruction | 20-40 | $250,000 | Yes |
| Major reconstruction | 0-20 | $500,000 | Yes |
The relationship between PCI and age follows a well-established curve. When a street is repaired, it stays in a state of good repair for a while, often around a decade, but then quickly begins to deteriorate before leveling off. How quickly this deterioration happens depends on a number of variables, but for our high level model we simply used one curve to represent local streets and another for arterials.
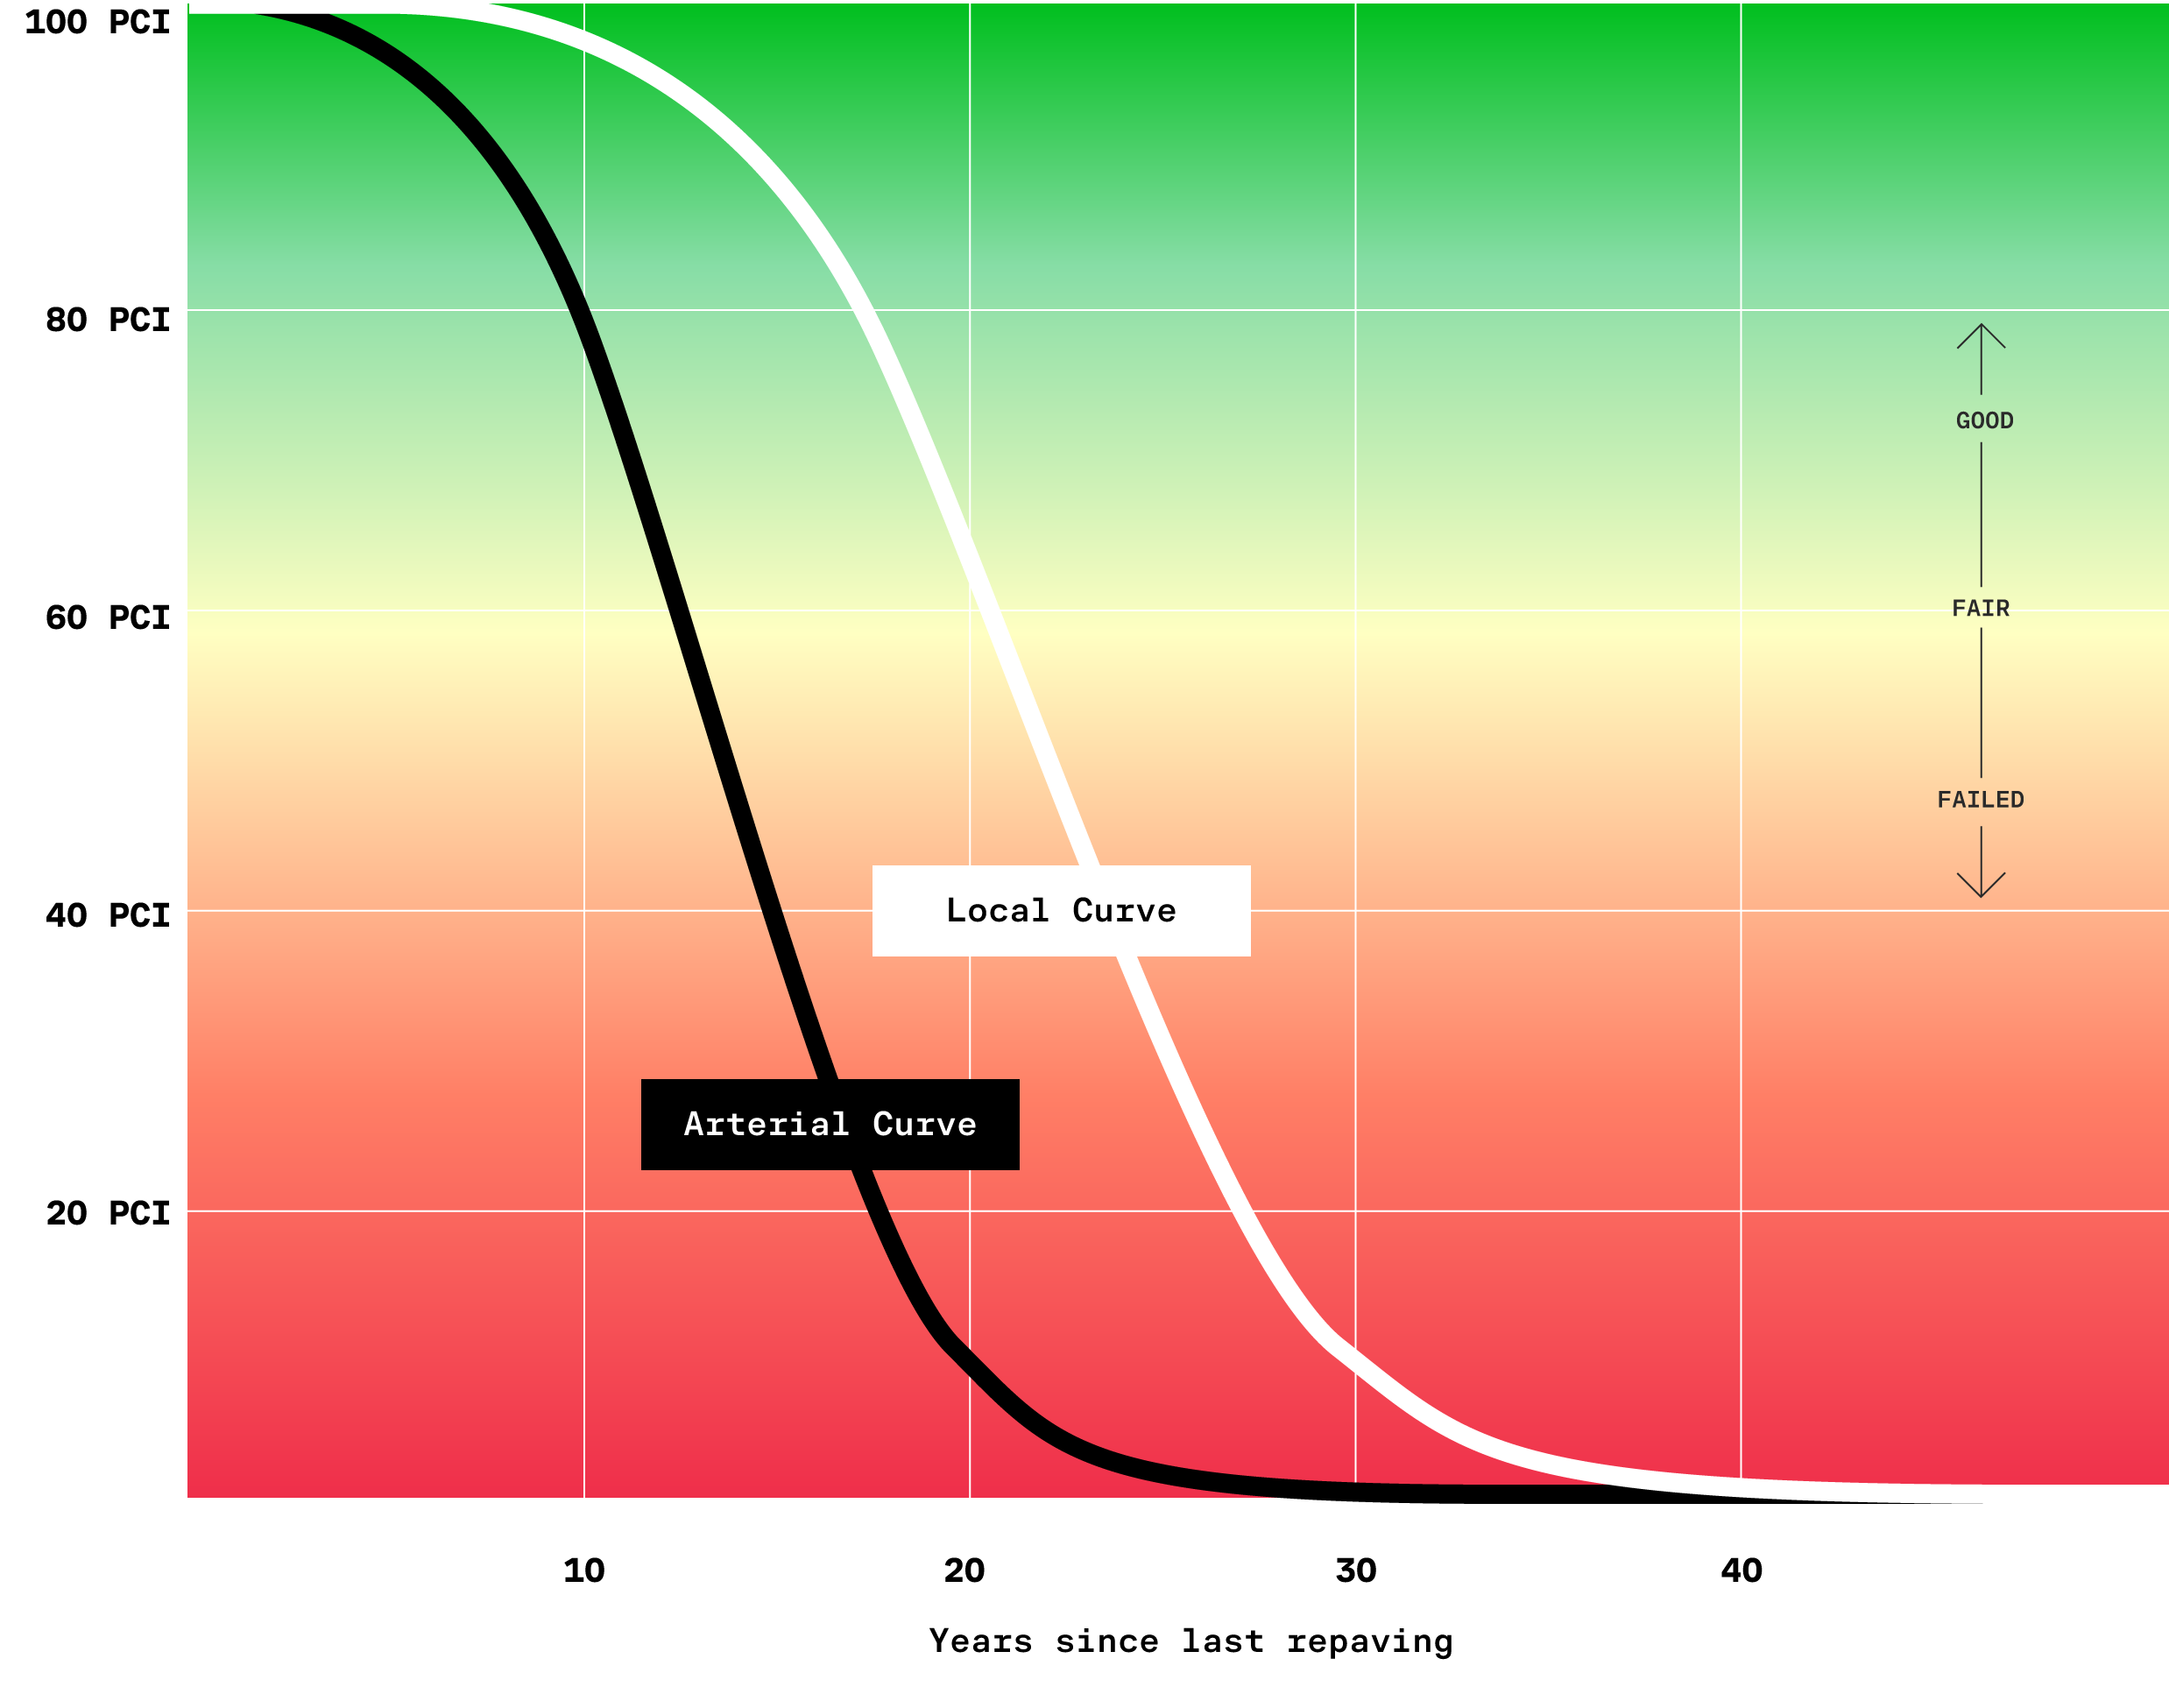
This chart shows how PCI changes over time. The curves are our approximate models, on arterial streets there is rapid deterioration around year 13, on local streets that happens around year 20.
This raises many interesting questions. Is it cheaper to only keep the ‘good’ streets in a high quality state, as the city currently does? Or is it better to fix the worst, most expensive, streets first? Our model outputs a ratio of 30% slurry seal and 70% repaving as ideal on paper, but that skips many real-world realities, top of which is that the worst streets, covered in potholes, are the ones elected officials are going to get the most angry complaints to fix.
The city of Los Angeles has long had a policy of keeping the streets that are in OK-to-good condition that way, while leaving the worst streets to deteriorate. In 2019 through 2024 Los Angeles spent an average of less than 15% of its pavement preservation budget fixing the streets in the very worst condition. The logic is that it is much less costly to keep a street in decent condition than it is to reconstruct it after it has failed. Therefore the city should focus on maintaining streets in decent condition. While sensible, if you don’t also have the money to reconstruct the failing streets they inevitably get worse. And if you don’t have enough money to even maintain the OK-to-good streets then eventually you end up with 7,500 miles of gravel and potholes.
Unfortunately that is the reality Los Angeles finds itself in, with the pavement preservation budget declining from $141.4 million in 2020 to just over $70 million in 2025 due to the City’s budget crisis. This is penny-wise but dollar-foolish, lowering near-term costs but increasing them an order of magnitude for future taxpayers. Even worse, this is only half of the current crisis.
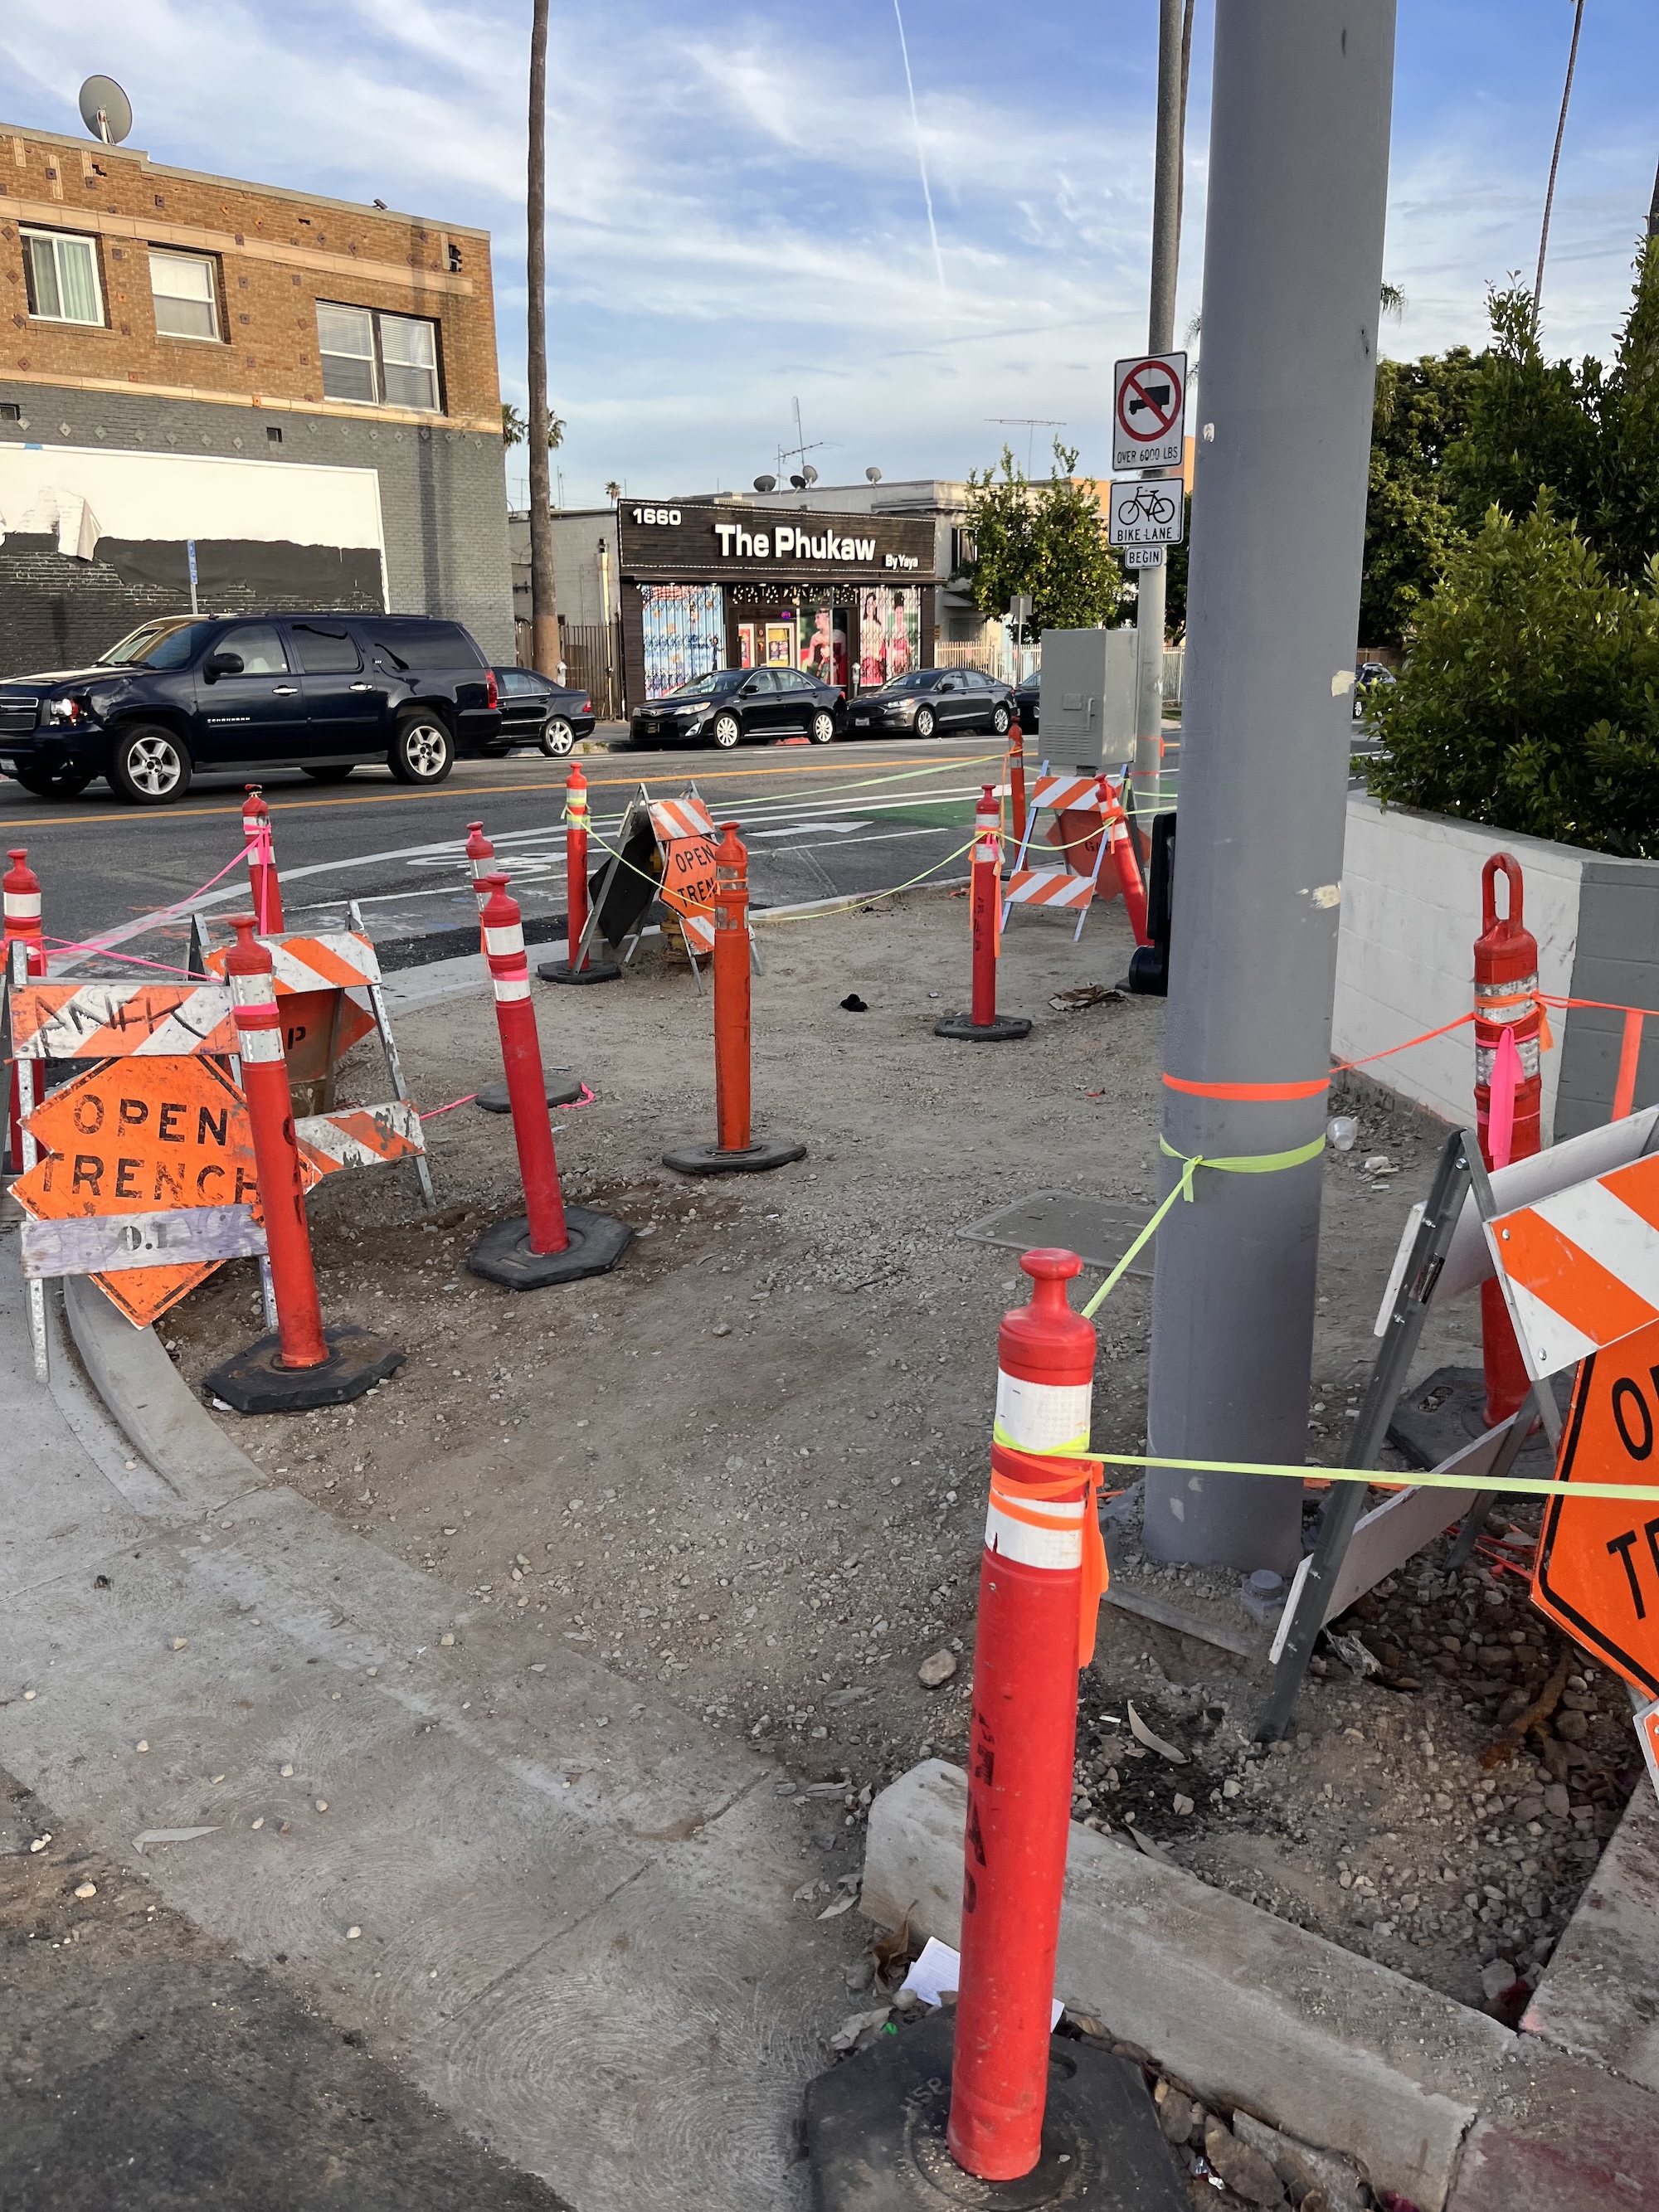
An access ramp under construction along Hollywood Blvd
Access Ramps and LA’s accessibility crisis
Access ramps critical pieces of infrastructure for allowing wheelchairs, strollers, or wheeled devices accessible use of sidewalks. Unfortunately, the vast majority of access ramps were built over 40 years ago, and few meet current ADA standards.
While federal law has required Cities to upgrade ramps alongside repaving since 1991, cities were allowed to slowly implement a transition plan. Los Angeles has largely failed to meet its obligation, occasionally building ramps in fits and starts, but never creating a cohesive plan or sticking to it. This has resulted in multiple lawsuits, chief among them is the Willits Settlement, a massive class action lawsuit over sidewalk accessibility. To get a better understanding of the multiple lawsuits and guidelines that have led us to this moment, we recommend Maylin Tu’s recent piece in Streetsblog.
Recently, the Willits Settlement was reopened due to LA’s failure in meeting its side of the deal. At the same time, the federal government has finalized new ADA guidelines called the Public Right-of-Way Accessibility Guidelines (PROWAG). While there has not been a clear public statement on City policy, it’s clear that BSS has slowly begun treating access ramp fixes as necessary when repaving roads. This can be seen in a growing PPP (Pavement Preservation Program) Access Ramp budget since 2023.
This chart shows the last 7 years of BSS spending on streets, sidewalks, and access ramp taken from budget documents. The sidewalk repair fund is legally mandated by the Willits settlement to be at least $30m a year adjusted for inflation. At least $5m of that must go towards access ramp request fixes.
Repairing a 25 year backlog across the largest street network in the nation is not simple or cheap. First, no one knows how many access ramps need to be upgraded. In 1998 the City estimated 108,000 access ramps were out of compliance with ADA law. The City’s dataset of ramps (generated by satellite imagery not surveys) has 91,000 items, but does not account for corners without curbs, and also makes no judgement about accessibility. The City is in the initial steps of completing a full sidewalk and access ramp inventory, but it is years away.
For our analysis, we settled on an estimate of 80,000 access ramps that need to be fixed by looking at historical BSS and BOE repairs along with estimates of 3rd party projects. While the City has been fixing access ramps over the last few decades (including a spurt of over 20,000 installed between 1999 and 2002), ADA regulation has continued to evolve, setting strict rules about ramp angle and landing areas. A ramp built fifteen years ago may not be compliant today. Our estimate could easily be off by 10,000 curb ramps in either direction, but it does not impact the model simulation much. Our most optimistic scenario only fixes 60% of ramps.
The City is further burdened by extraordinarily high costs for building individual access ramps. In 2014 the City estimated a ramp cost $3,000 to construct. Recent BSS reports now peg the cost of a single access ramp at a whopping $50,000, with the true cost probably higher due to pension and labor expenses. Compare this to the City of Beverly Hills, which is able to construct them at $10,000 per ramp. In LA, fixing access ramps at a single intersection could cost more than completely resurfacing an entire lane mile of street. In recent reports to the Charter Reform Commission, BSS has stated this effectively doubled the cost per mile of completing any street repaving.
All told, at current costs the City is looking at around four billion dollars to fix all the access ramps in the City. BSS looked at this and asked itself, what if we skirt ADA law one more time?
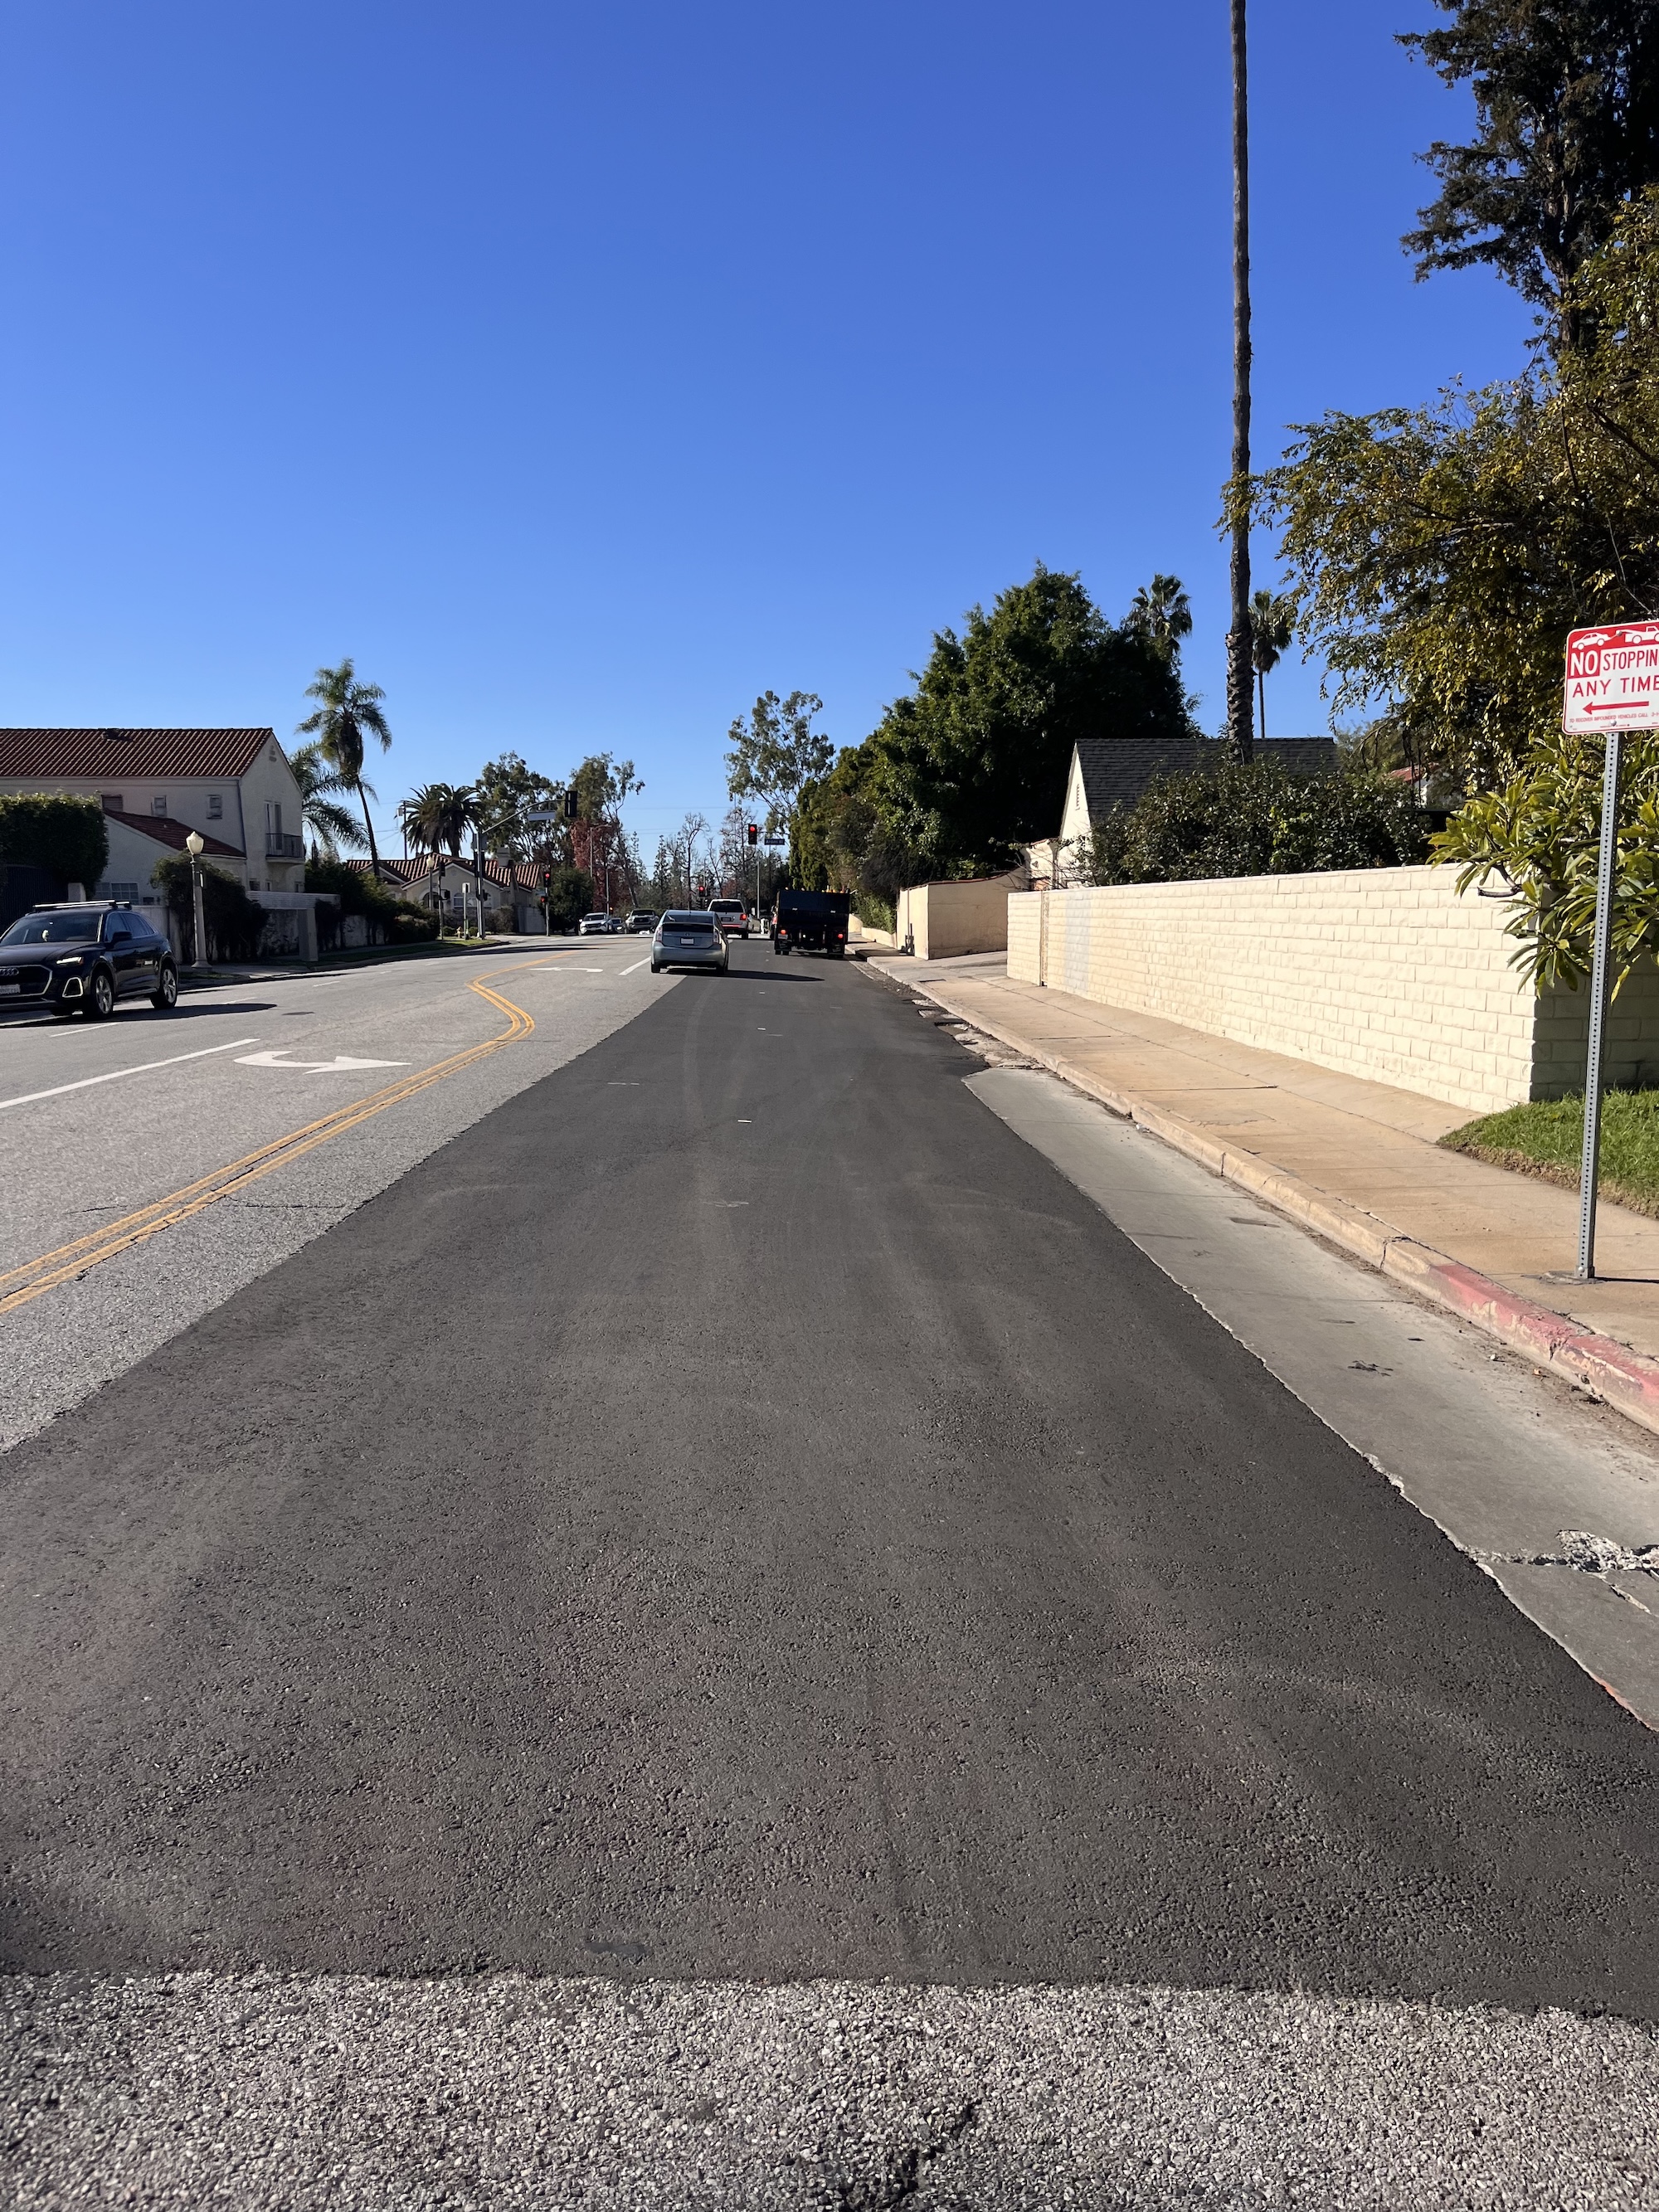
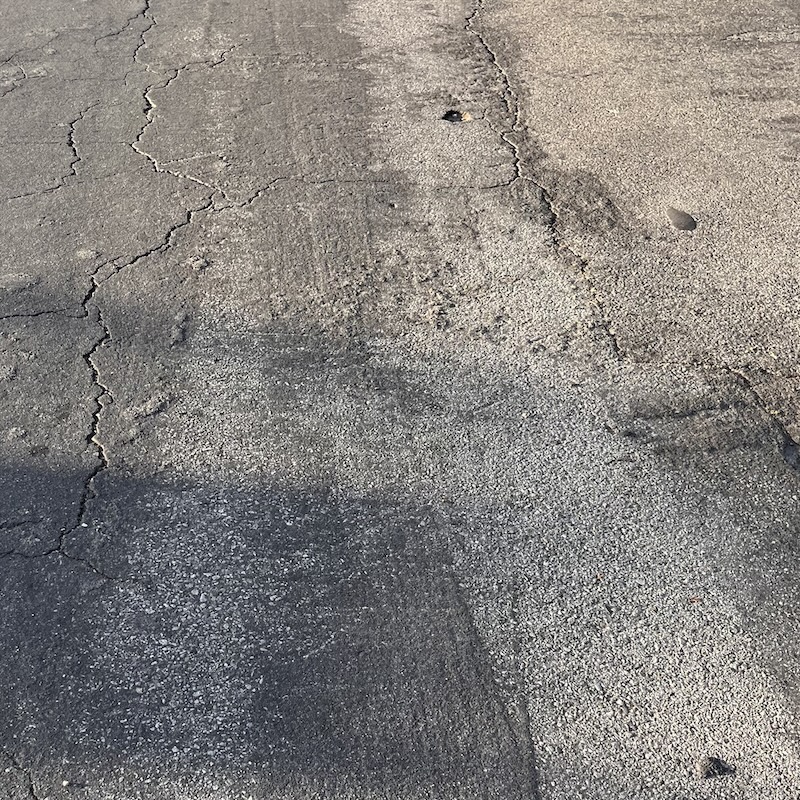
This is an image of Large Asphalt Repair installed in late 2025 on Beverly Blvd.
Why Large Asphalt Repair is a bad idea
To try to avoid the cost of access ramps the City has recently begun doing what it calls “large asphalt repair”. These are standard street repairs but limited to just a portion of part of the street, often not longer than a city block, and largely ending before intersections. By not repaving through crosswalks, City lawyers believe ADA repair requirements are not triggered. Street advocates began seeing these and flagging them as an accessibility and HLA violation. (Measure HLA passed by LA voters in 2024, requires that the city implement its planned safety improvements when repaving or repairing streets.) They also seem to violate the City’s own engineering guidelines: “The scope of projects shall not be structured to avoid the obligation to provide curb ramps when altering a roadway”.
As has been reported elsewhere, this fiscal year the City of LA is planning on almost no standard street repaving. Instead, nearly the entire repaving budget is being spent on Large Asphalt Repair. True to its history, BSS is once again chasing ‘better’ PCI scores instead of prioritizing the needs of the most vulnerable road users.
In conversations with BSS insiders, we have found the cost of Large Asphalt Repair at around $395,000 per lane mile – more than twice as much as standard resurfacing. BSS must bring the same specialized machinery and crews to the site, but then only fix a fraction of the roadbed, resulting in a much higher cost per square foot.
Over the long term, our model shows that Large Asphalt Repair has no notable PCI improvement compared to standard repaving. Instead, we end up spending about the same budget while fixing half the number of access ramps. In other words, we are wasting money on Large Asphalt Repair while not having any long term benefits.
What can we do?
-
Stop Large Asphalt Repair - While Large Asphalt Repair might make sense for small scale patching, it is not an economical tool for maintaining a large road network. It spends the same amount of money for a worse outcome, and increases future liability issues due to the access ramps that would otherwise be installed.
-
Don’t overindex on PCI - For decades BSS has treated pavement condition as the end all be all department goal. This creates perverse incentives, like repeatedly repaving roads in good shape to inflate scores. What is the value in smooth pavement if parts of it are not accessible to our most vulnerable road users? What is the value in smooth pavement if the street is designed in a way that kills people? Many other cities have proper complete street policies; when a street is touched, all planned improvements are made at the same time. This prevents waste and overlapping work. LA’s fragmented departments and bureaucracy have historically stymied this approach, but efforts like Measure HLA and a citywide CIP look to fix it.
-
Align city departments around the same goal - Infrastructure governance in LA is obfuscated by different departments and bureaus. We are reactive instead of proactive. The City does not have a federally mandated ADA transition plan. Vision Zero is a single team at LADOT instead of an empowered cross-department mandate. We need Mayoral leadership to align all city departments that have a role in maintaining and improving our streets. The ongoing Charter Reform effort is an opportunity to make some of these fixes, like empowering a Director of Public Works, removing language that prevents flexibility, and implementing a proper 5 year Capital Investment Program like many other cities have.
-
Find new revenue - While we need to spend money we have more efficiently, at the end of the day, we likely need additional dedicated funding to get a head start and prevent a large pileup of deferred maintenance. Bonds or parcel taxes are used by many other cities to cover this gap. LA can also explore other options, like Portland’s Heavy Vehicle Use Tax, making the heaviest road users contribute more to road repair. Many people driving on LA roads do not live in the City or contribute towards its taxbase, tools like congestion pricing can help recover otherwise lost revenue.
-
Find creative ways to reduce maintenance needs - LA has the largest street network in the nation and will likely always struggle to fully maintain it. Allocating road space to other uses can reduce or eliminate the cost of maintenance. For example, a cyclist would need to travel over a stretch of pavement over 100,000 times to equal the damage caused by a single car. Similarly, low cost street closures creating plazas can permanently reduce the maintenance needs for a piece of street. Council District 1’s proposal to transform a stretch of Wilshire Blvd into pedestrian space in MacArthur Park could be replicated across the City, removing thousands of lane miles of maintenance while expanding precious greenspace.
Methodology and Analysis
We wanted to see what it would cost for Los Angeles to not merely slow the decline of its streets but to actively improve them. There are a lot of variables to consider when answering this question: How do we decide which streets need what treatment? How much does each treatment cost? Are we including access ramps? Are we doing inefficient large asphalt repairs? How quickly are we trying to make the improvements? We tried to answer these by grounding our analysis in what Los Angeles has historically done. We started by using the planned 2026-27 annual budget of $123M as our baseline budget scenario. We looked at each type of treatment commonly done (slurry sealing, resurfacing and reconstruction) and used the average percent of the budget spent on those during the same time period as our allocation for each treatment type: 13% of the budget goes to reconstruction, 67% to resurfacing and 20% to slurry sealing To determine which streets would receive which treatments we used the city’s measurement of the pavement condition index (PCI) for each of the more than 72,000 street segments the city tracks.
Guided by the letter grades the city assigns to ranges of PCI values, we then assigned streets with a PCI of less than or equal to 19 to a “needs complete reconstruction” category. Streets with a PCI of 20-40 were put in a cheaper reconstruction category, while those with a PCI of 41-70 were deemed to need resurfacing. Those with a PCI of 71-85 were planned for slurry sealing only (aside from larger, non-local streets, which the city does not slurry seal). A PCI of 86 or above needed no treatment.
Streets made of cement, rather than asphalt, make up 5% of streets in LA but follow much different deterioration curves. These streets can last 40 or 50 years before needing to be fixed. Unfortunately, these streets are generally very old, in need of repair, and require full reconstruction. Our model includes these streets in the PCI averaging, but does not repair them or include them in the deferred maintenance total.
Having set up our parameters, we then ran a ten year simulation where we selected street segments in need of slurry sealing, resurfacing or reconstruction (choosing the segments with the lowest PCI in each category) and treating as many as we could until the budget for the year ran out. Street selections were made by starting bottom up, or lowest PCI score per category first. This prevents leakage from one category to a more expensive category as much as is possible. It’s important to note this ‘ideal optimization’ likely is not fully reflective of the different political considerations BSS needs to make when scheduling street maintenance.
If at any point we had more money for, say, slurry sealing than there were street segments that needed it we rolled the extra funding to reconstruction. Similarly, extra reconstruction funding was rolled to resurfacing and extra resurfacing funding to slurry sealing. A treated segment was upgraded to a PCI of 100, except for those receiving slurry sealing, which instead had their age rolled back by five years (the average amount that slurry sealing extends the life of an LA road) and their PCI score updated accordingly.
Access Ramps
In addition to simulating the pavement preservation program, we also simulated the building of access ramps. The city has more than 100,000 corners requiring access ramps, of which three to four thousand have been fixed in the last 10 years. Once fixed, access ramp life is generally over 25 years, so we don’t enter them back into the simulation.
We selected a total bucket of 80,000 ‘needed’ access ramps to the model in our simulation. Each lane mile of road repaved requires a certain density of access ramps (this was calculated separately for local streets and arterials) to be built at the same time, and those are subtracted from the Citywide outstanding access ramp inventory.
There are some other ways that access ramps can be built though. The largest of which is a dedicated floor of $5m annually from the Willits mandated Sidewalk Repair Fund. Some BOE and LADOT projects funded by grants will replace access ramps using contractors, third parties like Metro, Caltrans, or private developers also occasionally replace ramps with given work in the City. To model this, we created a static budget of $10 million/year just for dedicated access ramp construction/updates. This happens regardless of any repaving, and is subtracted out of the total number of access ramps needed.
Slowly over time, the more access ramps the City builds the more efficient road repaving should get, as fewer corners need to be updated. To account for this the ratio of built to unbuilt access ramps is used to determine if any access ramps can be skipped for a given lane mile of repaving. Only the largest budget scenarios benefited from this.
Predicting Pavement Quality
Meanwhile we simulated the aging of all untreated streets following the curves shown above in this report. Unfortunately the actual data do not remotely reflect the tidiness of that curve. The real age-to-PCI data is scattered and as bumpy as an unmaintained LA alley. We assume this is because while the age is a simple calculation of the last time a road was repaved, the City regularly goes back and patches potholes and cracks. This may improve PCI, and fracture the neat pattern relationship we would expect to see between age and condition. However the first six years after a road is repaved its PCI does seem to follow a curve. We surmise that this is because the city doesn’t actually measure the PCI of recently repaved roads but instead estimates it using the given curve (or something similar). After that all real correlation between age and PCI is lost. We have survivor effects (for example, concrete roads more than 40 years old often have a PCI higher than their younger siblings), outliers (roads that are only 12 years old with a PCI of a road three times older) and generally all manner of noise in the data. We don’t know how much of this is bad data, sporadic measurements (our Freedom Of Information Act request for historical PCI data was denied, so we were unable to compare changes for specific segments over time), or just a truly weak correlation between age and PCI.
There are many examples of simplified PCI prediction curves, both from BSS presentations and general research. We used these sigmoid curves, and took the PCI of a street segment to neatly match age onto our deterioration curve, enforcing a requirement that the PCI of an untreated segment could never improve to help deal with outliers that were already in worse condition for their age than the curve would predict.