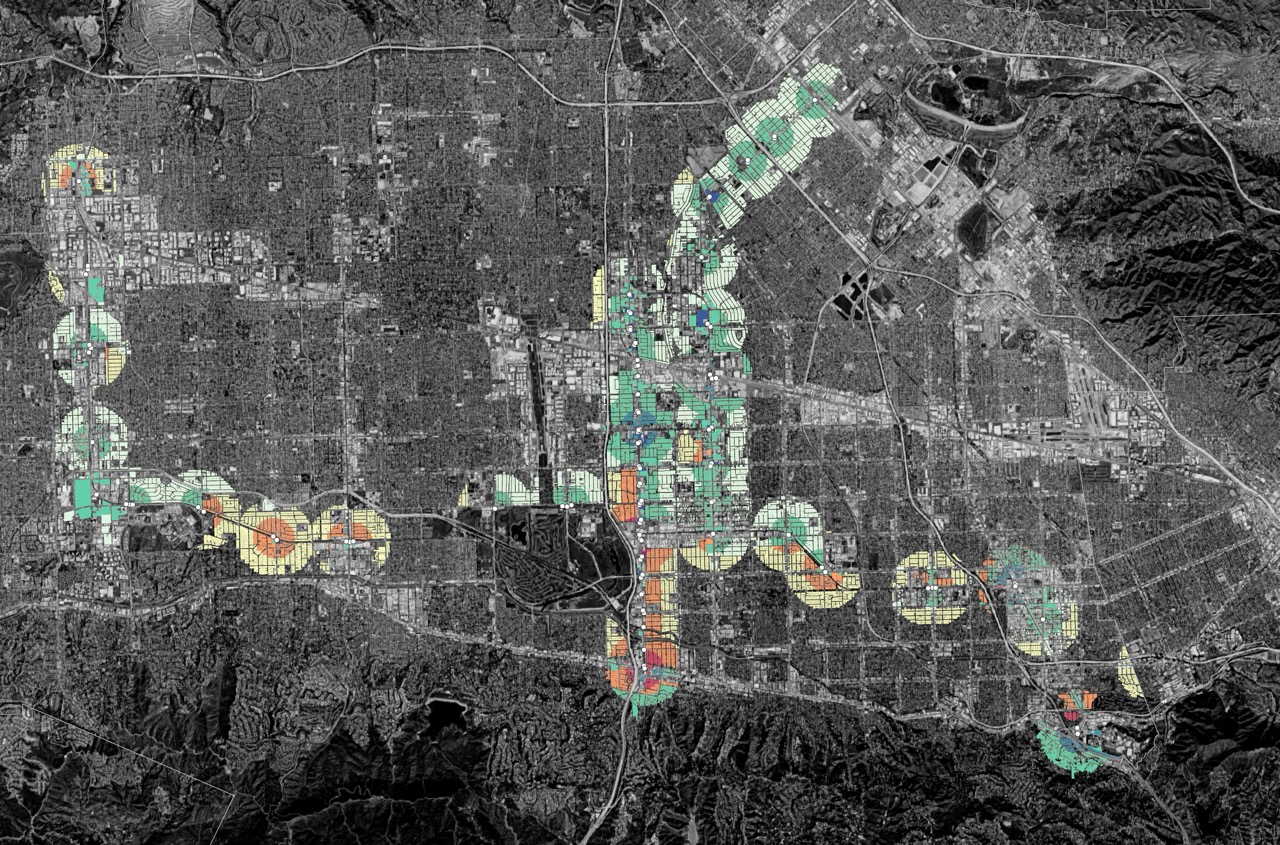
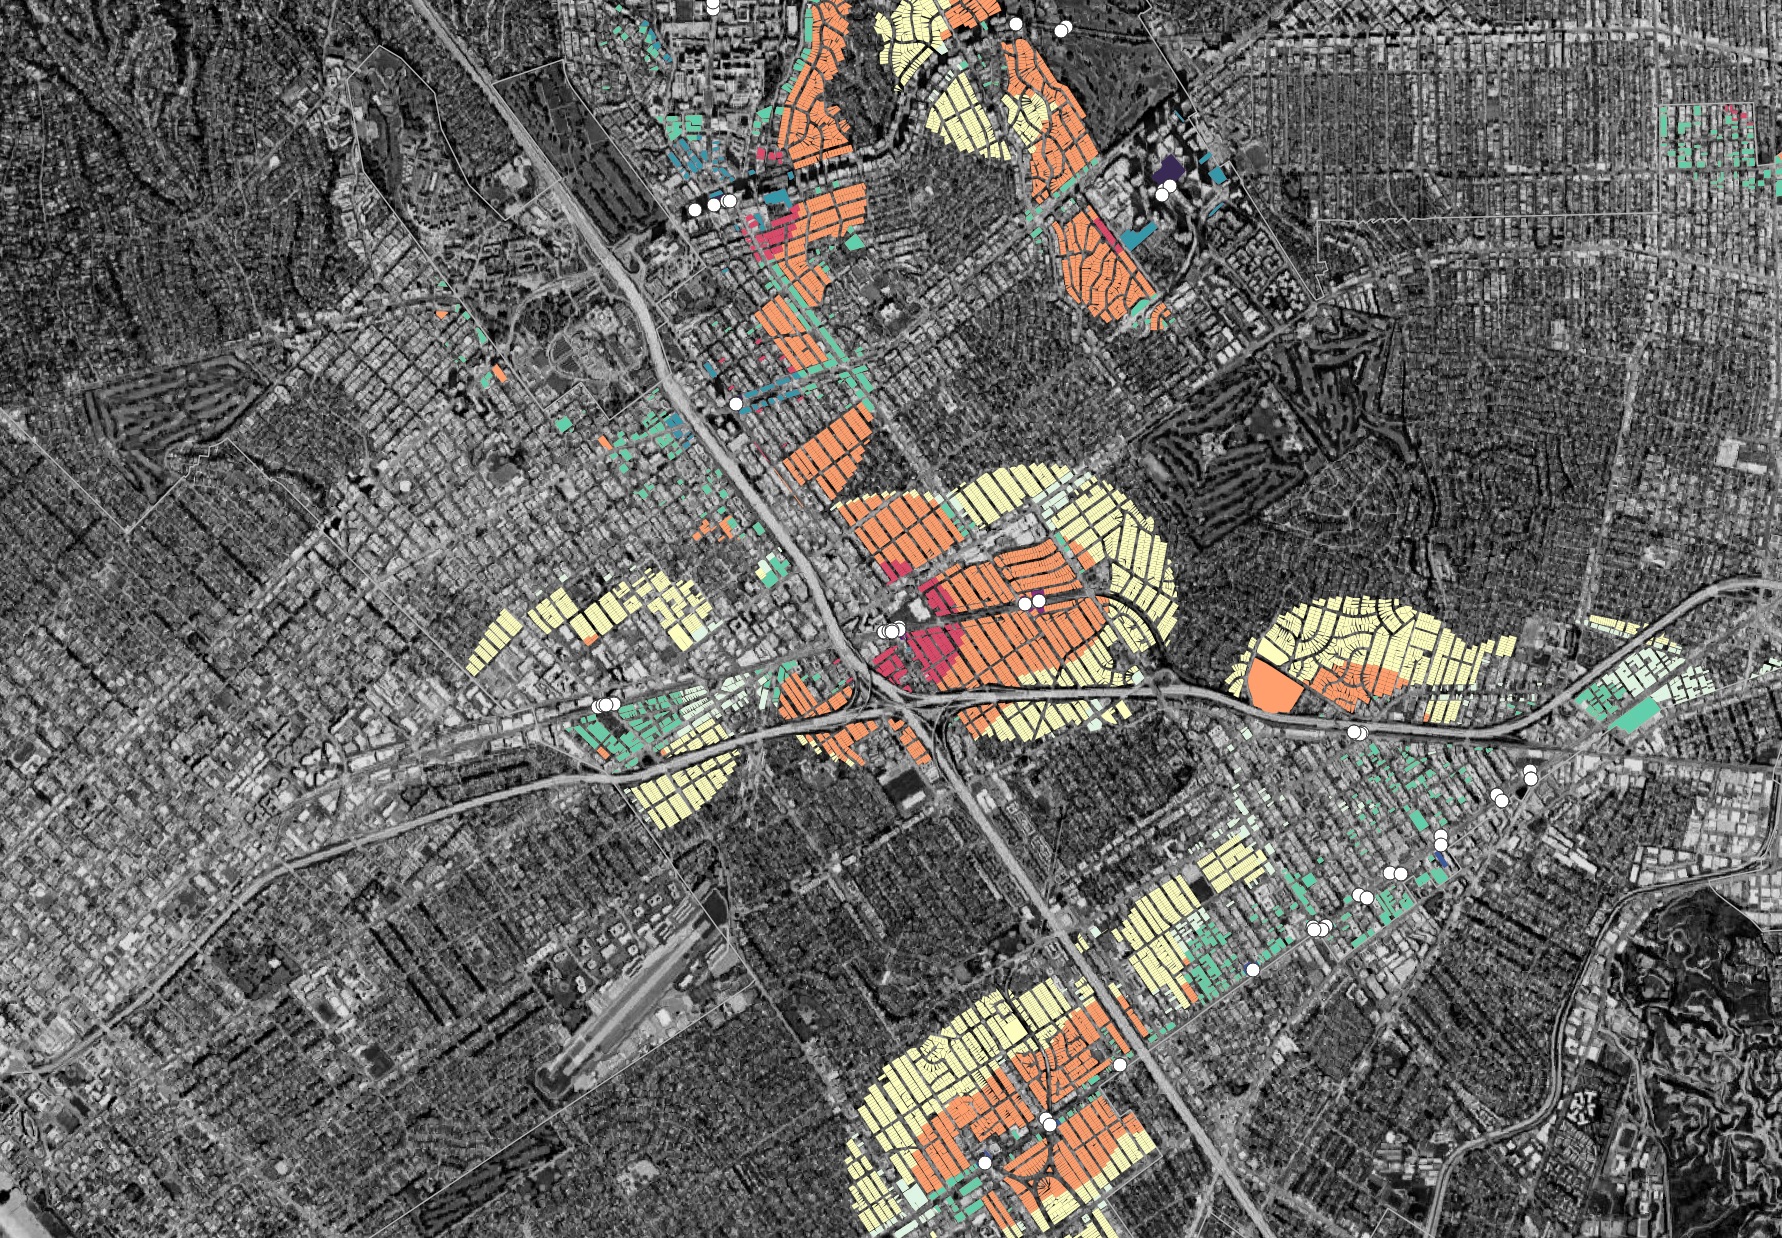
We estimate the San Fernando Valley will eventually be upzoned for 500,000 new units of potential housing, with over 150,000 units unlocked in July 2026.
SB 79 just legalized 1.5 million new homes near transit in the City of LA
Table of Contents
Now that SB 79 has been signed, about 750 transit stops will trigger upzoning under SB 79 across California, and around 150 of those can be found in the City of Los Angeles. This report is an initial attempt to calculate the realistic zoned capacity being added by SB 79 in the City of LA.
Note: these are preliminary findings. Only when regional Metropolitan planning organizations create official maps will we have a concrete picture of SB 79. Key takeaways:
- SB 79 will eventually zone nearly 1.5 million (1,456,150) new units of housing in the City of LA. This would be enough to double LA’s current housing stock of 1.37 million homes
- It will immediately zone for 448,260 new units when SB 79 goes into effect July 1, 2026, and upzone for at least another 1,007,890 units of housing during RHNA Cycle 7 in 2031
- SB 79 will impact 17,929 acres, or a little over 5% of the City’s land. Half of impacted acres were previously zoned exclusively for single family homes (9,953 acres).
These findings show SB 79 is one of the largest erosions of exclusionary zoning in Los Angeles history, opening up significant parts of the City for both multifamily and affordable housing. Alongside addressing the housing crisis, focused growth near major bus and rail stops will strengthen transit ridership, reduce automobile dependency across the region, and allow for more vibrant livable neighborhoods.
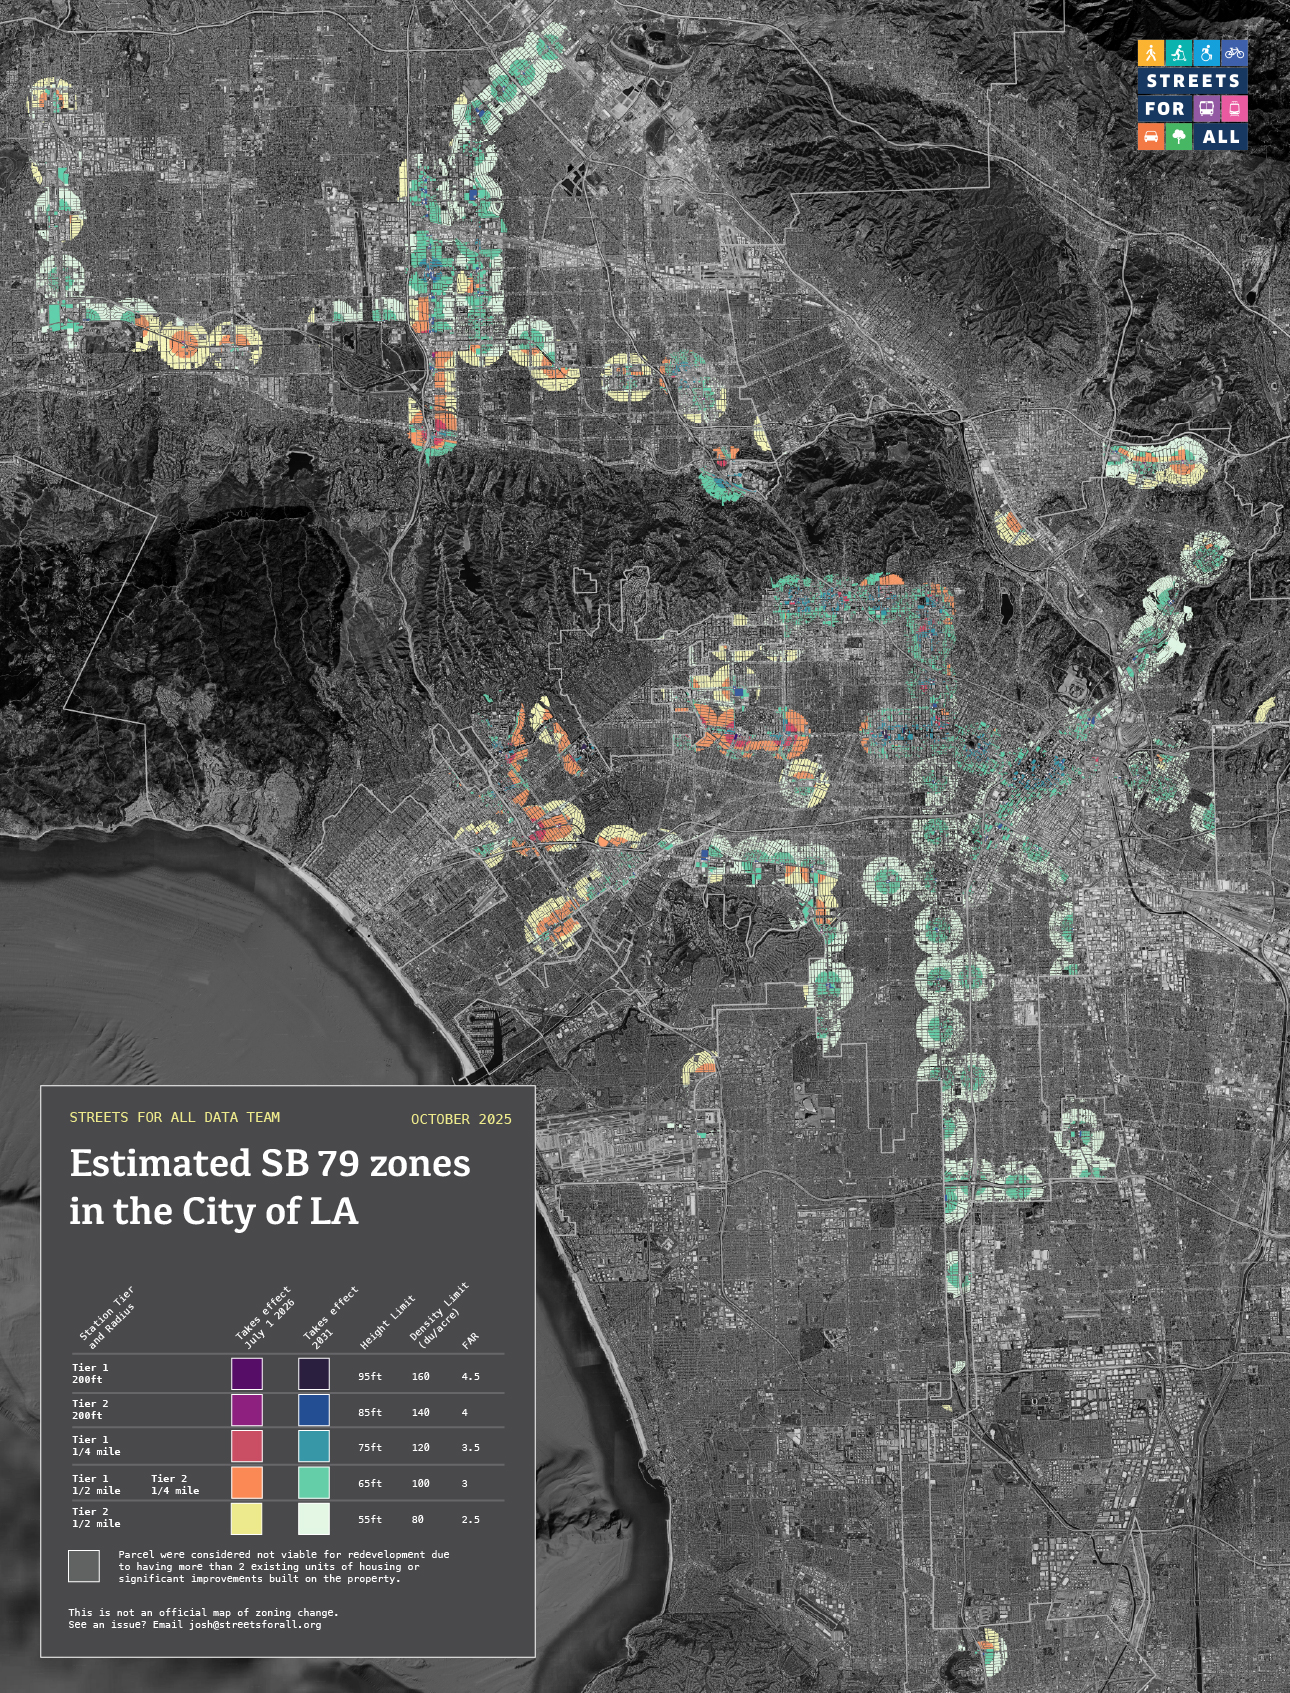
Full rezoning map for the City of Los Angeles. Click here for a high res version
Impacted Stations
There’s been plenty written on how SB 79 will upzone and which stations trigger compliance. We assume the reader has some knowledge of the bill, and will point out places where we differ from existing interpretations.
First, we used a combination of internal maps, alongside those released by City of LA planning and CA Yimby staff to establish impacted rail stations. We’ve followed the city’s lead of including both Sepulveda (Alt 4) and K Line North (Hybrid) despite neither line currently having a preferred alternative (the trigger for 79). Within the next year they will likely be chosen, but stations, radiuses, and affected parcels of course may be different.
We also used station entrances when available instead of station centerpoints. This was done using this Metro dataset along with some manual additions for projects with completed design.
Some stations on the J Line, may or may not qualify. The buses technically operate in an HOV lane (instead of 24/7 transit only) but do pull into dedicated bus only station areas. We have included them.
We’ve varied significantly from other maps of the LA area by using new Cal-ITP data instead of SCAG data to map high quality transit stops (they calculate under the most up to date definition of AB 2553 - 2024). This ends up capturing far more stops along 24/7 bus lanes in the City of LA, largely on Sepulveda and Venice. There is also a pair of bus stops captured on Wilshire near the Los Angeles Country Club that will upzone the nearby single family neighborhoods, including many mansions in Holmby Hills. Will LA choose to use it’s limited historic preservation acreage to protect the Playboy Mansion?
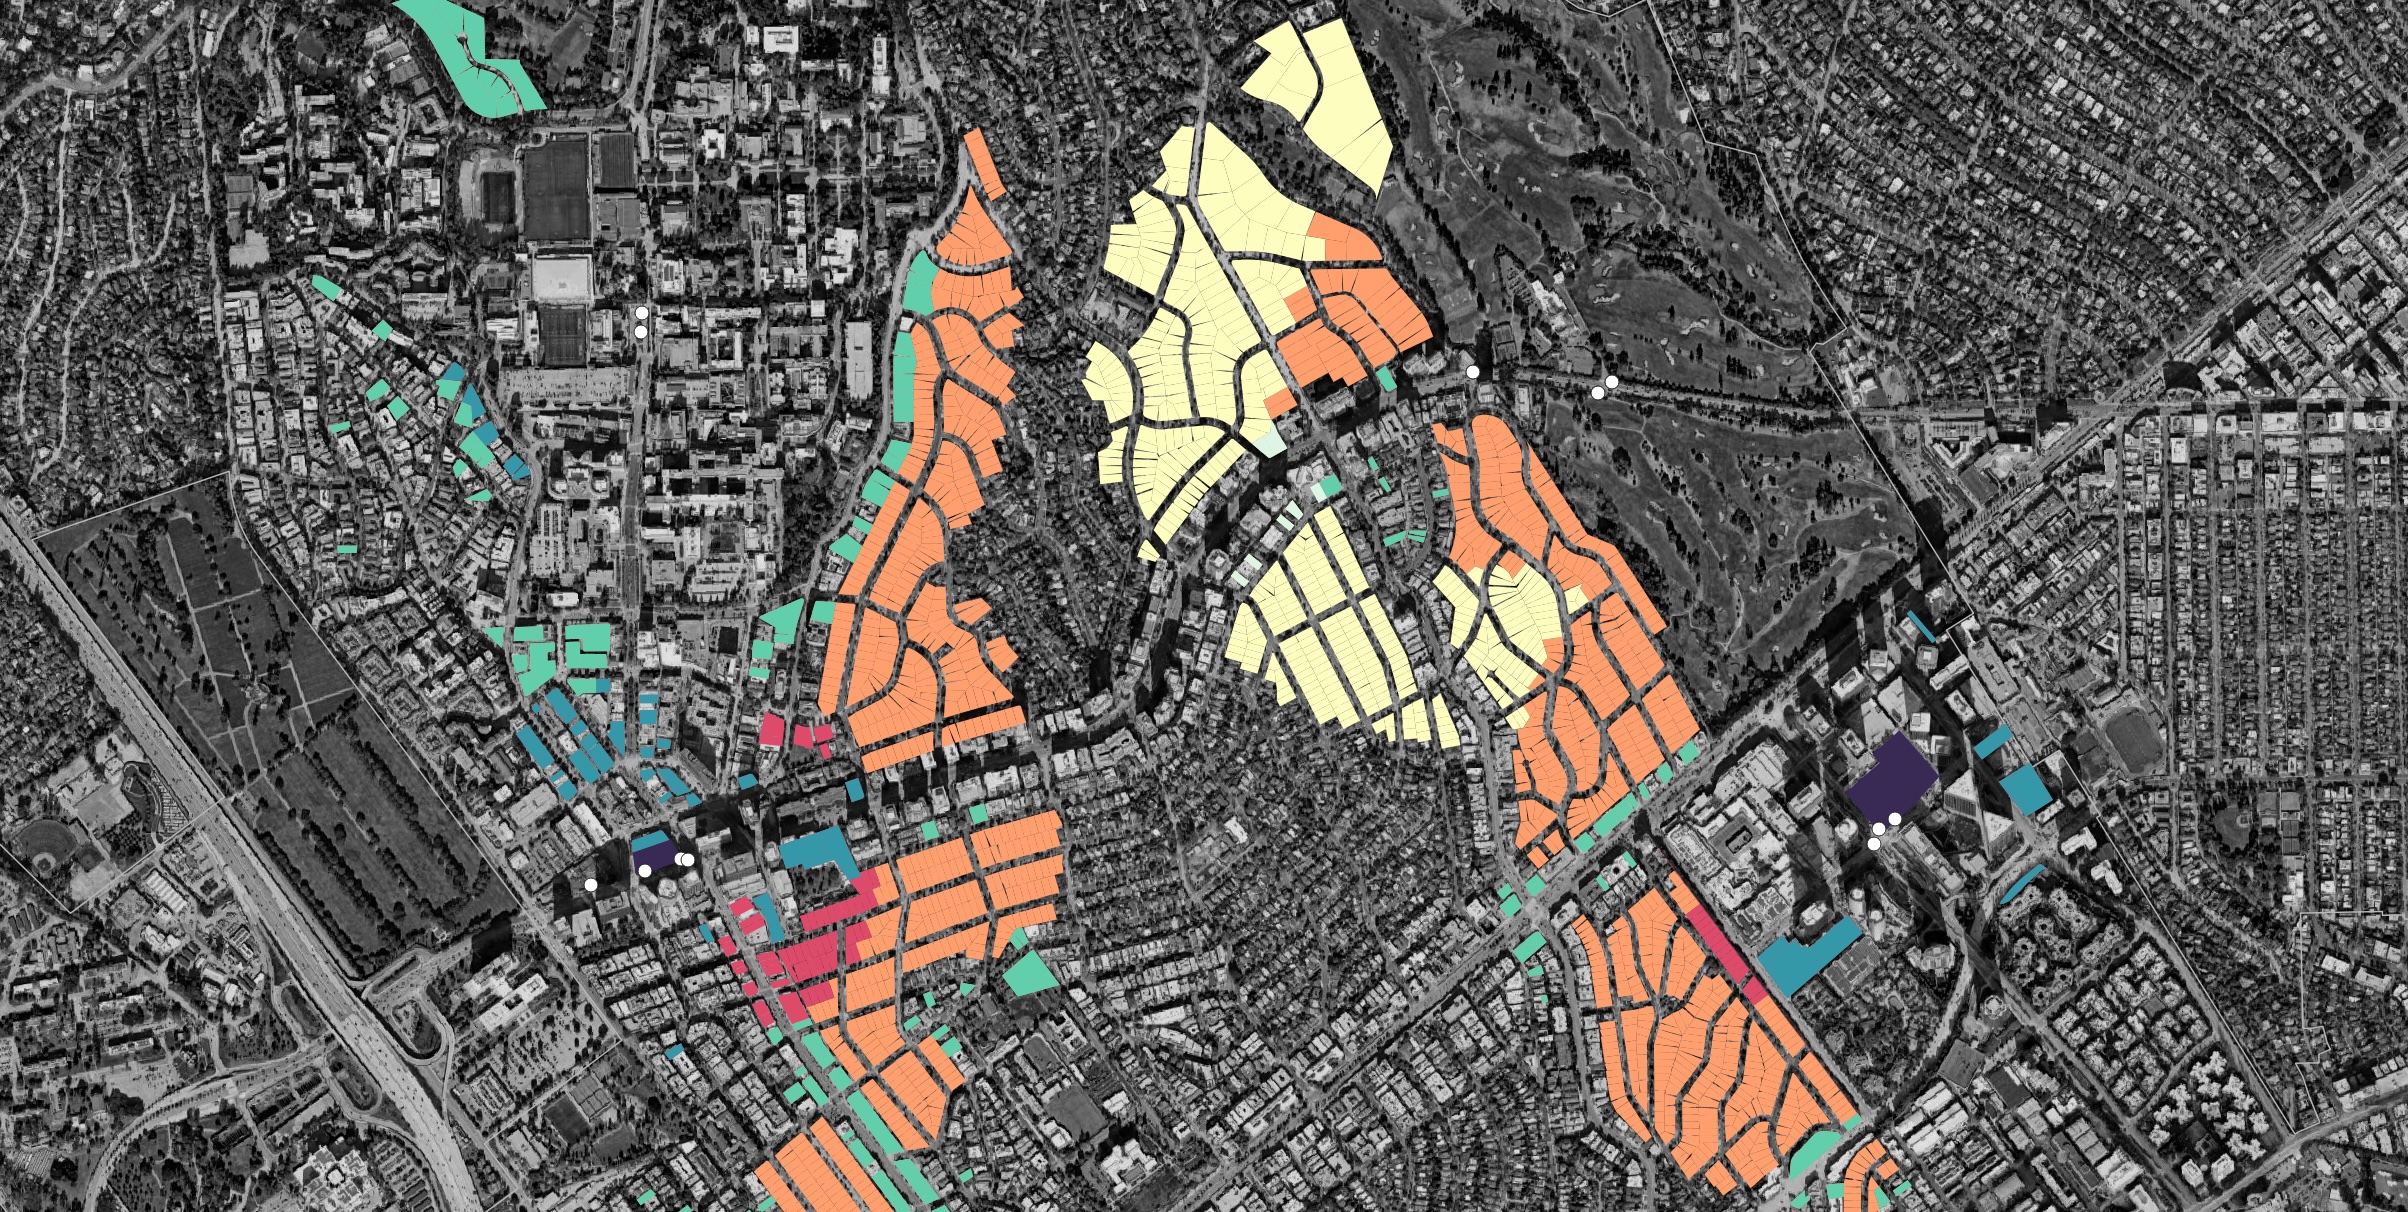
Long live condo canyon.
Zoning Exclusions
The many compromises made to get SB 79 across the finish line result in a complicated bill, with multiple layered exemptions. These fall into two categories: 1) a parcel exemption from any impact due to either explicit language or language that makes the parcel unlikely to be developed and 2) creating the option to postpone parcels from SB 79 short term until the next RHNA cycle in 2031 if they meet specific conditions.
Inside of each station catchment area we’ve fully excluded parcels that aren’t commercial or residential (no public or industrial land). We’ve chosen to also exclude any parcel with more than 2 units as they are very unlikely to be redeveloped under the bill.
Similarly, any non R1/R2 (click here to read about how we generalize LA zoning) zoned parcel with an improvement ratio under 1 is ignored as we consider it an unlikely candidate for development. (this is calculated by dividing the value of assessed land by the value of assessed improvements - i.e. is there a large building here). One caveat is our parcel assessment data is a few years old, so the most recent developments may be analyzed as ‘empty lots’ and appear on the map as viable parcels.
There are a couple triggers for when a parcel’s zoning can be pushed to the next RHNA cycle. These require new zoning ordinances, but LA has already suggested it will try and utilize any tools to slow SB 79 mandated upzoning. We consider our scenario conservative, or ‘max possible postponement’.
- Parcels in a very high fire severity zone can be postponed.
- Parcels designated in low-resource areas can be postponed.
- Parcels in a station area where the local zoning already allows 50% of the units and floor area that would have been allowed by SB 79 can be postponed.
Low resource areas are the largest reason for postponement in LA, covering about half of all impacted parcels. Not a surprise considering the many low income neighborhoods in LA with high displacement risk were one of the main drivers for the exemption to be included in 79.
One qualifier we didn’t mention; parcels with a designated historic resource, was ignored because it is limited to 10% of a given station 1/2 mile catchment, and LA’s historic preservations are generally supersized neighborhood zones. That said, some individual parcels will likely be exempted from upzoning.
Qualifier 3 above, a 50% capacity criteria, is the chewiest, as it requires understanding the max potential build out of a given parcel under City of LA zoning code. This is not easily programmatic.
The City of LA recently passed its Citywide Housing Incentive Program (CHIP) to satisfy state requirements to zone for new potential units. Instead of an explicit zoning change, LA layered multiple incentives that developers can choose to take in specific areas. This makes creating a simplified zoning model so complex that we chose to ignore it for the original analysis.
CHIP is a layer on top of an already very dense nest of qualifiers like height limits, FAR limits, setbacks, ‘special zones’ denoted by a ‘Q-’ defined in explicit ordinances, TOC areas, etc, that make up the meat of LA zoning (on top of a fully new zoning system beginning to be rolled out community by community). Fortunately (for us), the vast majority of SB 79 zoning overlaps relevantly with one component of CHIP: Transit Oriented Incentive Areas (TOIA).
Under TOIA, only R1 and R2 are universally unable to meet the 50% threshold. Within ¼ mile of a tier; the base zoning must be commercial, R5, or R4 to qualify, even with density bonuses. That means all commercial, R4, R5, and the vast majority of R3 parcels near stations will likely have their upzoning postponed until 2031 if the City decides to. Fortunately, the other main component of CHIP, Opportunity Corridors, has almost full overlap with what we’ve already exempted and doesn’t need to be separately calculated.
Come July, the Westside will be upzoned for an additional 100,000 units with another 60,000 unlocking in 2031. This is on the back of the Citywide Housing Incentive Program passsing in 2024, allowing significantly more homes in the area - especially on commercial corridors. Not mapped are SB 79 triggered upzonings in Santa Monica, Beverly Hills, and Culver City.
Calculating New Apartments
To calculate the number of new potential apartment per parcel we heavily leaned on work in this UCLA research paper by Aaron Barrall and Shane Phillips. We calculated the number of potential units twice with two different potential limiters, then took the more restrictive of the two on a per parcel basis. The first equation simply uses density (max number of units per acre) and multiplied that by the acreage of the parcel. The second equation takes the max FAR per acre, multiplies that by the parcel acreage, then divides by a reasonable unit size and residential efficiency (to account for hallways/egress space).
This approach is somewhat simplistic, and doesn’t account for ways that state density bonus law, or the city’s own Transit Oriented Incentive Areas could act to add density to height. Our estimate assumes the City acts to cap potential density as aggressively as legally permissible.
We also did not study the impact of lot consolidation, which would allow larger buildings on many of the smaller single family parcels near transit stops. Lot consolidation could also act to bring in developable multifamily new land, as parcels outside the 79 radius are merged with those impacted by it.
Finally, to make sure we were calculating net units, we subtracted any units existing on the lot (of which should only be a max of two).
As always, our calculations can be run locally using jupyter notebook files here. Please reach out with questions or datasets.