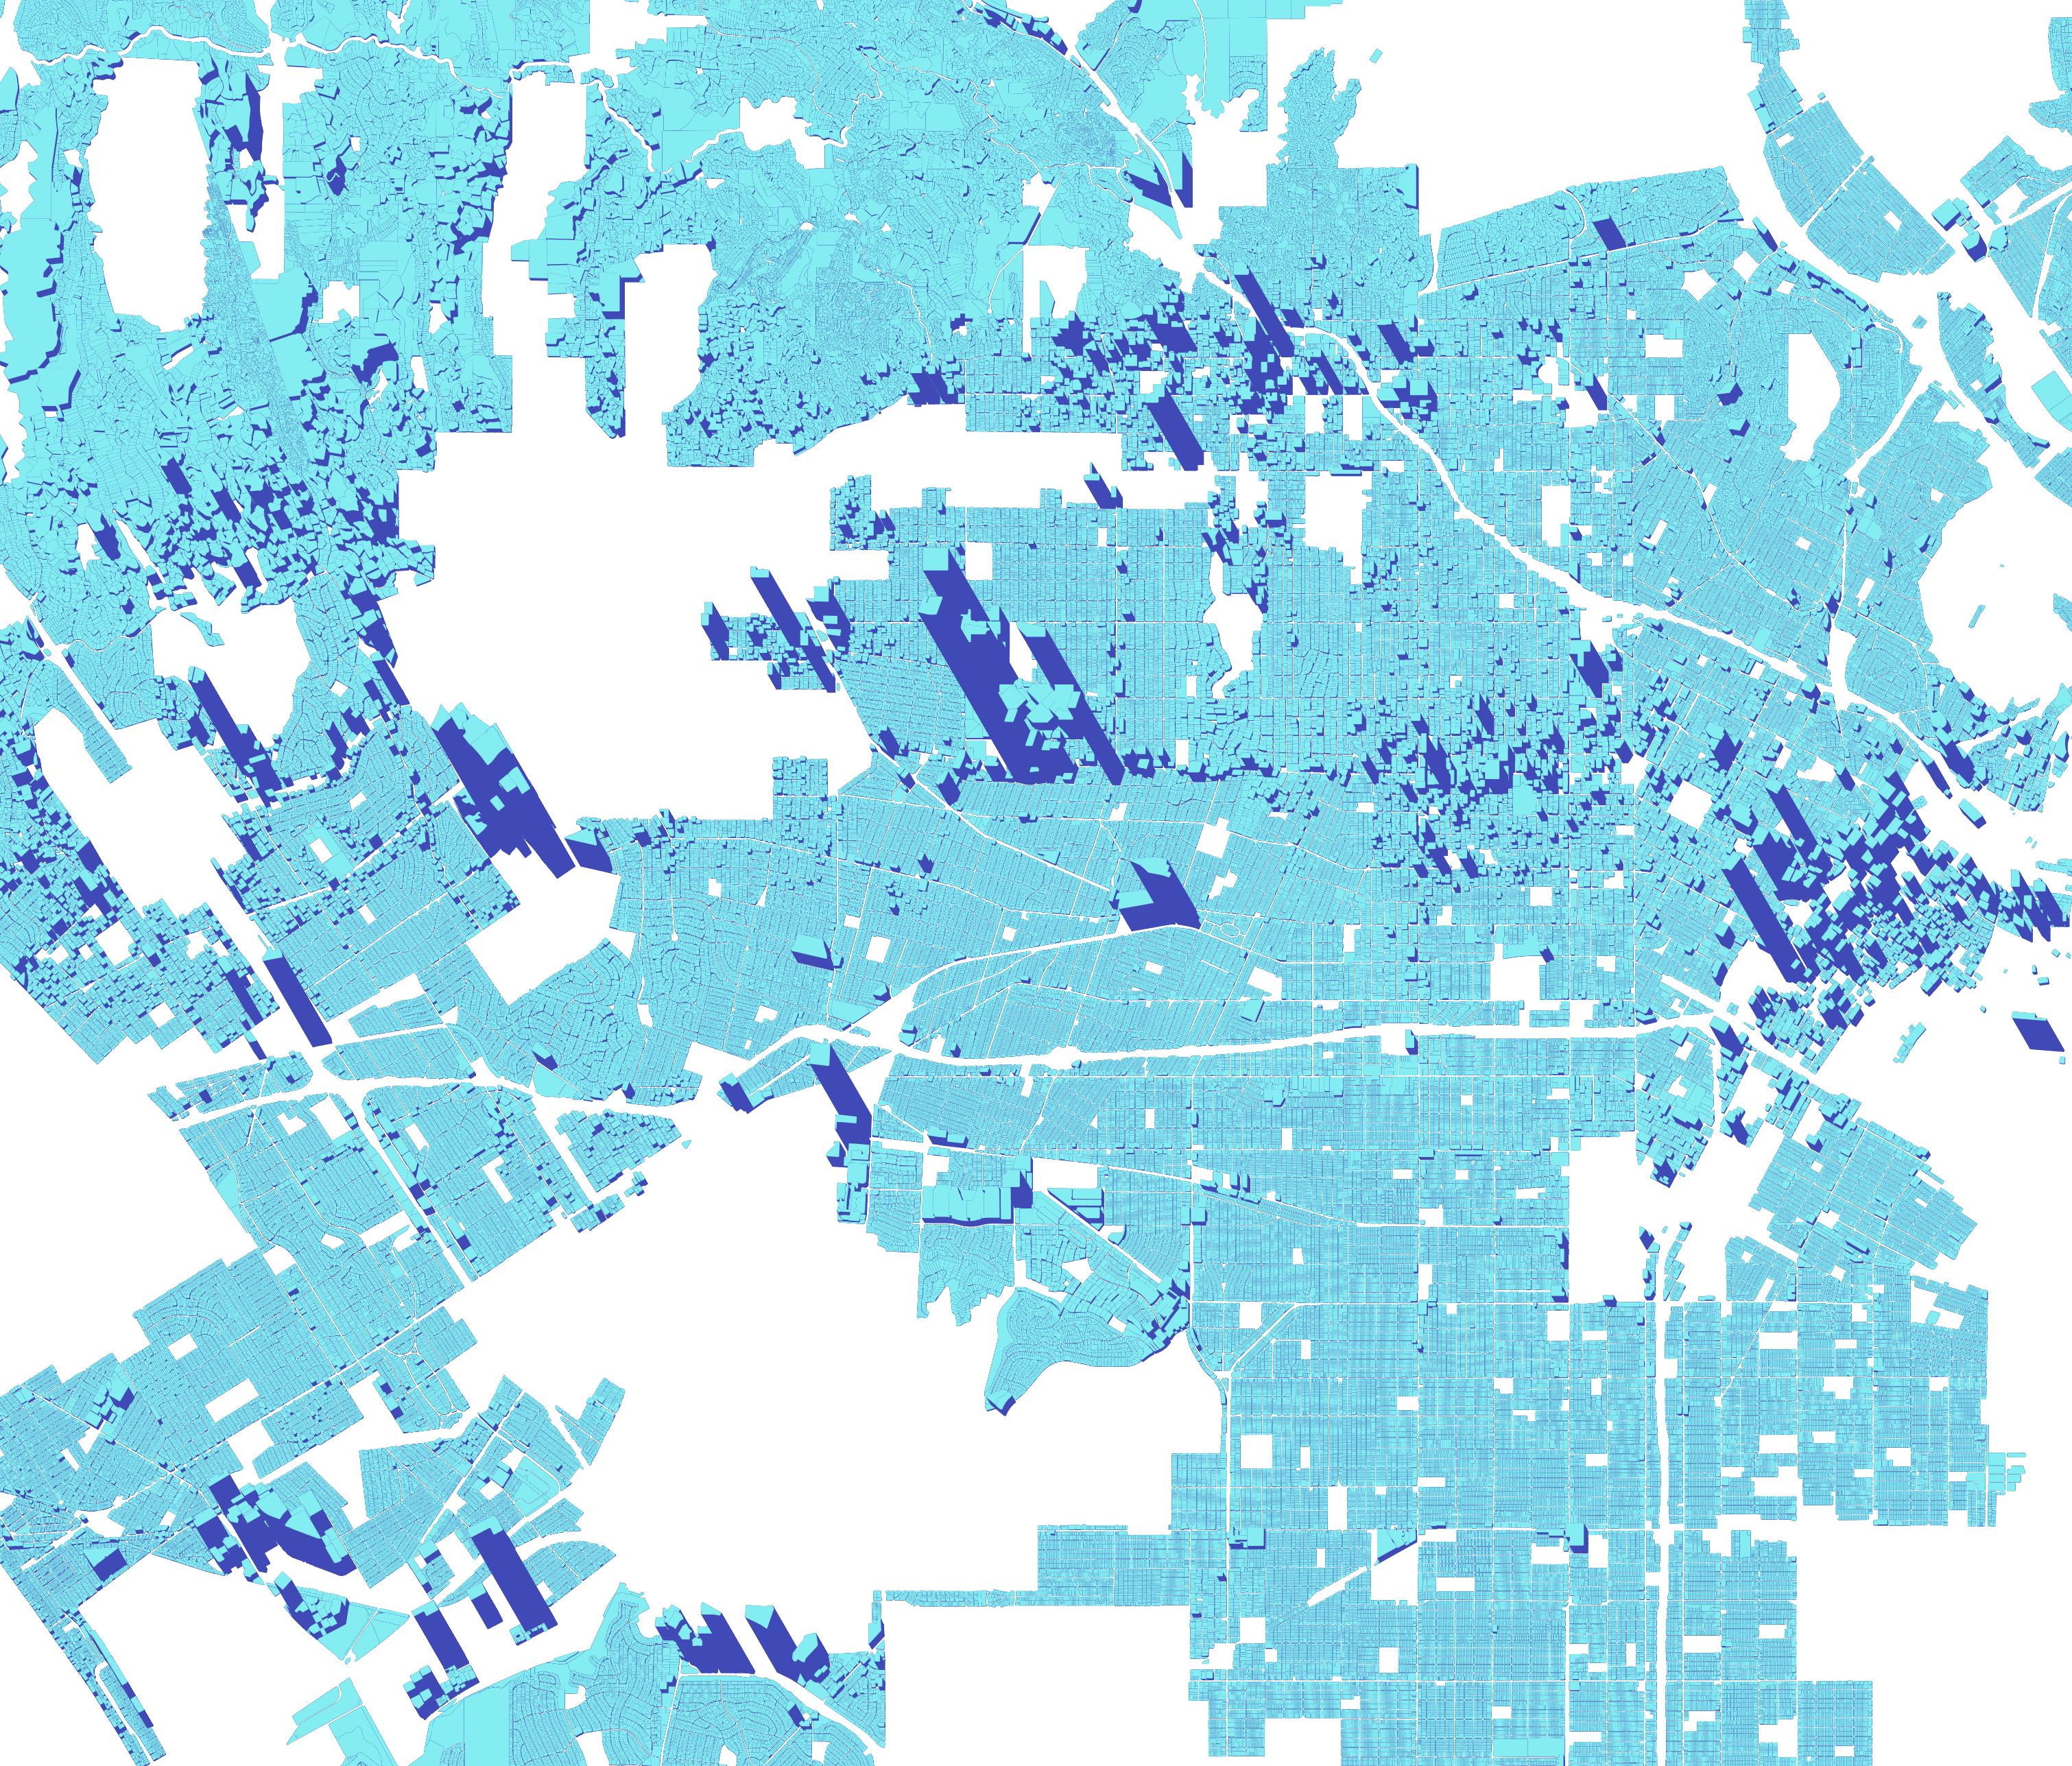
Height map of property tax revenue per parcel in the core of Los Angeles.
How Land Use Reform Could Help Solve the Los Angeles Budget Crisis
Table of Contents
The City of LA is facing a massive nearly $1 Billion budget shortfall in 2025, largely due to a combination of salary increases and settlement payouts. It’s hard to overstate the dire consequences of this deficit, which threatens many vital services, but specifically would be catastrophic for progress on SFA’s core mission to build safer, more efficient roads in Los Angeles.
Our high-level analysis shows how restrictive, exclusionary zoning has accentuated the City’s financial crisis, and how targeting upzoning could help balance budgets. Using the potential upzoning that would occur if Senate Bill 79 passes, we show how the City’s largest single revenue source, property taxes, are currently stifled by poor land use. Key takeaways:
- Multi-family housing and commercial parcels represent 12% of the residential suitable land in the City of LA, but almost half of its property tax revenue.
- In LA 45% of residential suitable parcels near high quality transit stops are zoned exclusively for low density
- SB 79 would create capacity to grow the City of LA’s annual property tax income by nearly $1 billion
- The money saved by this year’s 1,647 layoffs is nearly equal to the estimated revenue created by redeveloping only 20% of parcels rezoned under SB 79
Generally, higher density uses have vastly higher property tax values, and we’ve found this to be true in Los Angeles. With the vast majority of residential zoning in LA limited to single family homes and other low densities, the City is leaving potential revenue on the table.
It’s important to be clear that rezoning won’t solve the city of LA’s deficit immediately. Our model requires redevelopment to take place before revenue increases. One way to think about it is had SB79 passed 5 or 10 years ago, the current budget outlook would be far more positive.
We’ve taken our model of property taxes, zoning, and built a utility for the public to use. Different combinations of zoning and redevelopment can be created and the estimated property tax revenue is outputted.
Why are there two different per acre columns?
‘Avg Tax/Acre’ is a full sampling of all parcels in the zone. ‘Recent Avg Tax/Acre’ represents a sample limited to just parcels rerolled (constructed or modified) in the last decade. We explain this more below but this is to solve for how Prop 13 dilutes property values over time. ‘Recent Avg Tax/Acre’ is far more representative of the value a new development would be assessed at.
What does the redevelopment ratio mean?
The redevelopment ratio allows users to choose what percent of acres adjusted in the calculator are included in the model’s estimated property tax revenue. For example, a 20% ratio means 20% of the land near transit stations has been redeveloped. Our model does not make assumptions about the timeline for capturing the value of upzoning but it’s fair to say a 100% redevelopment scenario would be many decades away.
Why is the sum of Property taxes lower than the estimated roll?
Our model only looks at what we call ‘residentially suitable parcels’ which represents about half of land in the City and ignores things like parks and manufacturing. This year the areas our model ignores will bring in $998,281,212 in property taxes to the City of LA which we simply add to the topline figure.
Why does downzoning sometimes increase revenue?
This edge case happens because of Prop 13. Our model considers any change in zoning viable for redevelopment, and enough new low density zoning can sometimes offset small amounts of dense (but older) zoning. For example a recently assessed R1 parcel has an average property tax income higher than a historically averaged R3 parcel.
What is SB 79?
SB79 (sponsored by Streets for All) is one of the largest housing bills moving through the state legislature this session. It does two things: sets minimum zoning densities across the state near high capacity transit, and allows transit agencies more flexibility in developing land that they own. We are focused on the former impact in this study.
In LA, 45% (10,421 acres) of potential residential parcels near Metro stops are limited by zoning to either single family homes, duplexes, or parking lots. As a region we are spending billions in taxpayer dollars to build high quality transit but suffocating ridership with poor land use.
SB79 would upzone along existing and planned transit lines. The upzones come in 3 levels, the highest density would be concentrated along the D and B lines through DTLA, Hollywood, Koreatown, and Century City, with medium density added along light rail and bus projects (including new transit projects like the Vermont BRT and East San Fernando Valley Light Rail).
All told, SB 79 would impact around 7.5% of residential zoning in LA and 3.3% of the City’s total land area.
Allowing multi-family housing near transit also brings other benefits: it allows people to live closer to work and amenities, it reduces vehicle miles driven, and overall brings much needed new housing capacity to the City of LA. Notable for this study, new multi-family transit oriented development would also be a significant increase in property tax revenue for the City compared to previous uses.
Building a Simplified Zoning Model for Los Angeles
Los Angeles has hundreds of unique combinations of zoning codes. The first step of our analysis was to figure out how to translate this complicated system into a generalized zoning map that reflected, at a high level, what could be built per parcel.
We decided to use codes that are simple to understand and reflect different levels of residential density: R5, R4, R3, R2, R1. Specific category decisions were made looking at existing zoning, buildings, and in consultation with land use attorneys. R1 can be thought of as a single family home, R2 represents a duplexe, and R3 to R5 represent increasing levels of multifamily development from bungalow courts to highrises. While this is a coarse model, it means that we are comparing what is actually being built in different zoning conditions in the City of LA without trying to model complicated attributes like setbacks, floor-to-area ratio (FAR), or community overlays. For a full list of our generalized zoning codes see this spreadsheet.
What we are calling “residentially suitable land” means all land in the city NOT zoned for park space, municipal uses (such as schools), agricultural uses, manufacturing, open space, or roads. The land we’ve excluded you can see in the map below in green.
Using our zoning map, we find that over 100,000 acres of land, or 45% of all residentially suitable land, is zoned for low density (R1, R2, or Parking), within a ½ mile radius of SB79’s definition of a high quality transit stop.
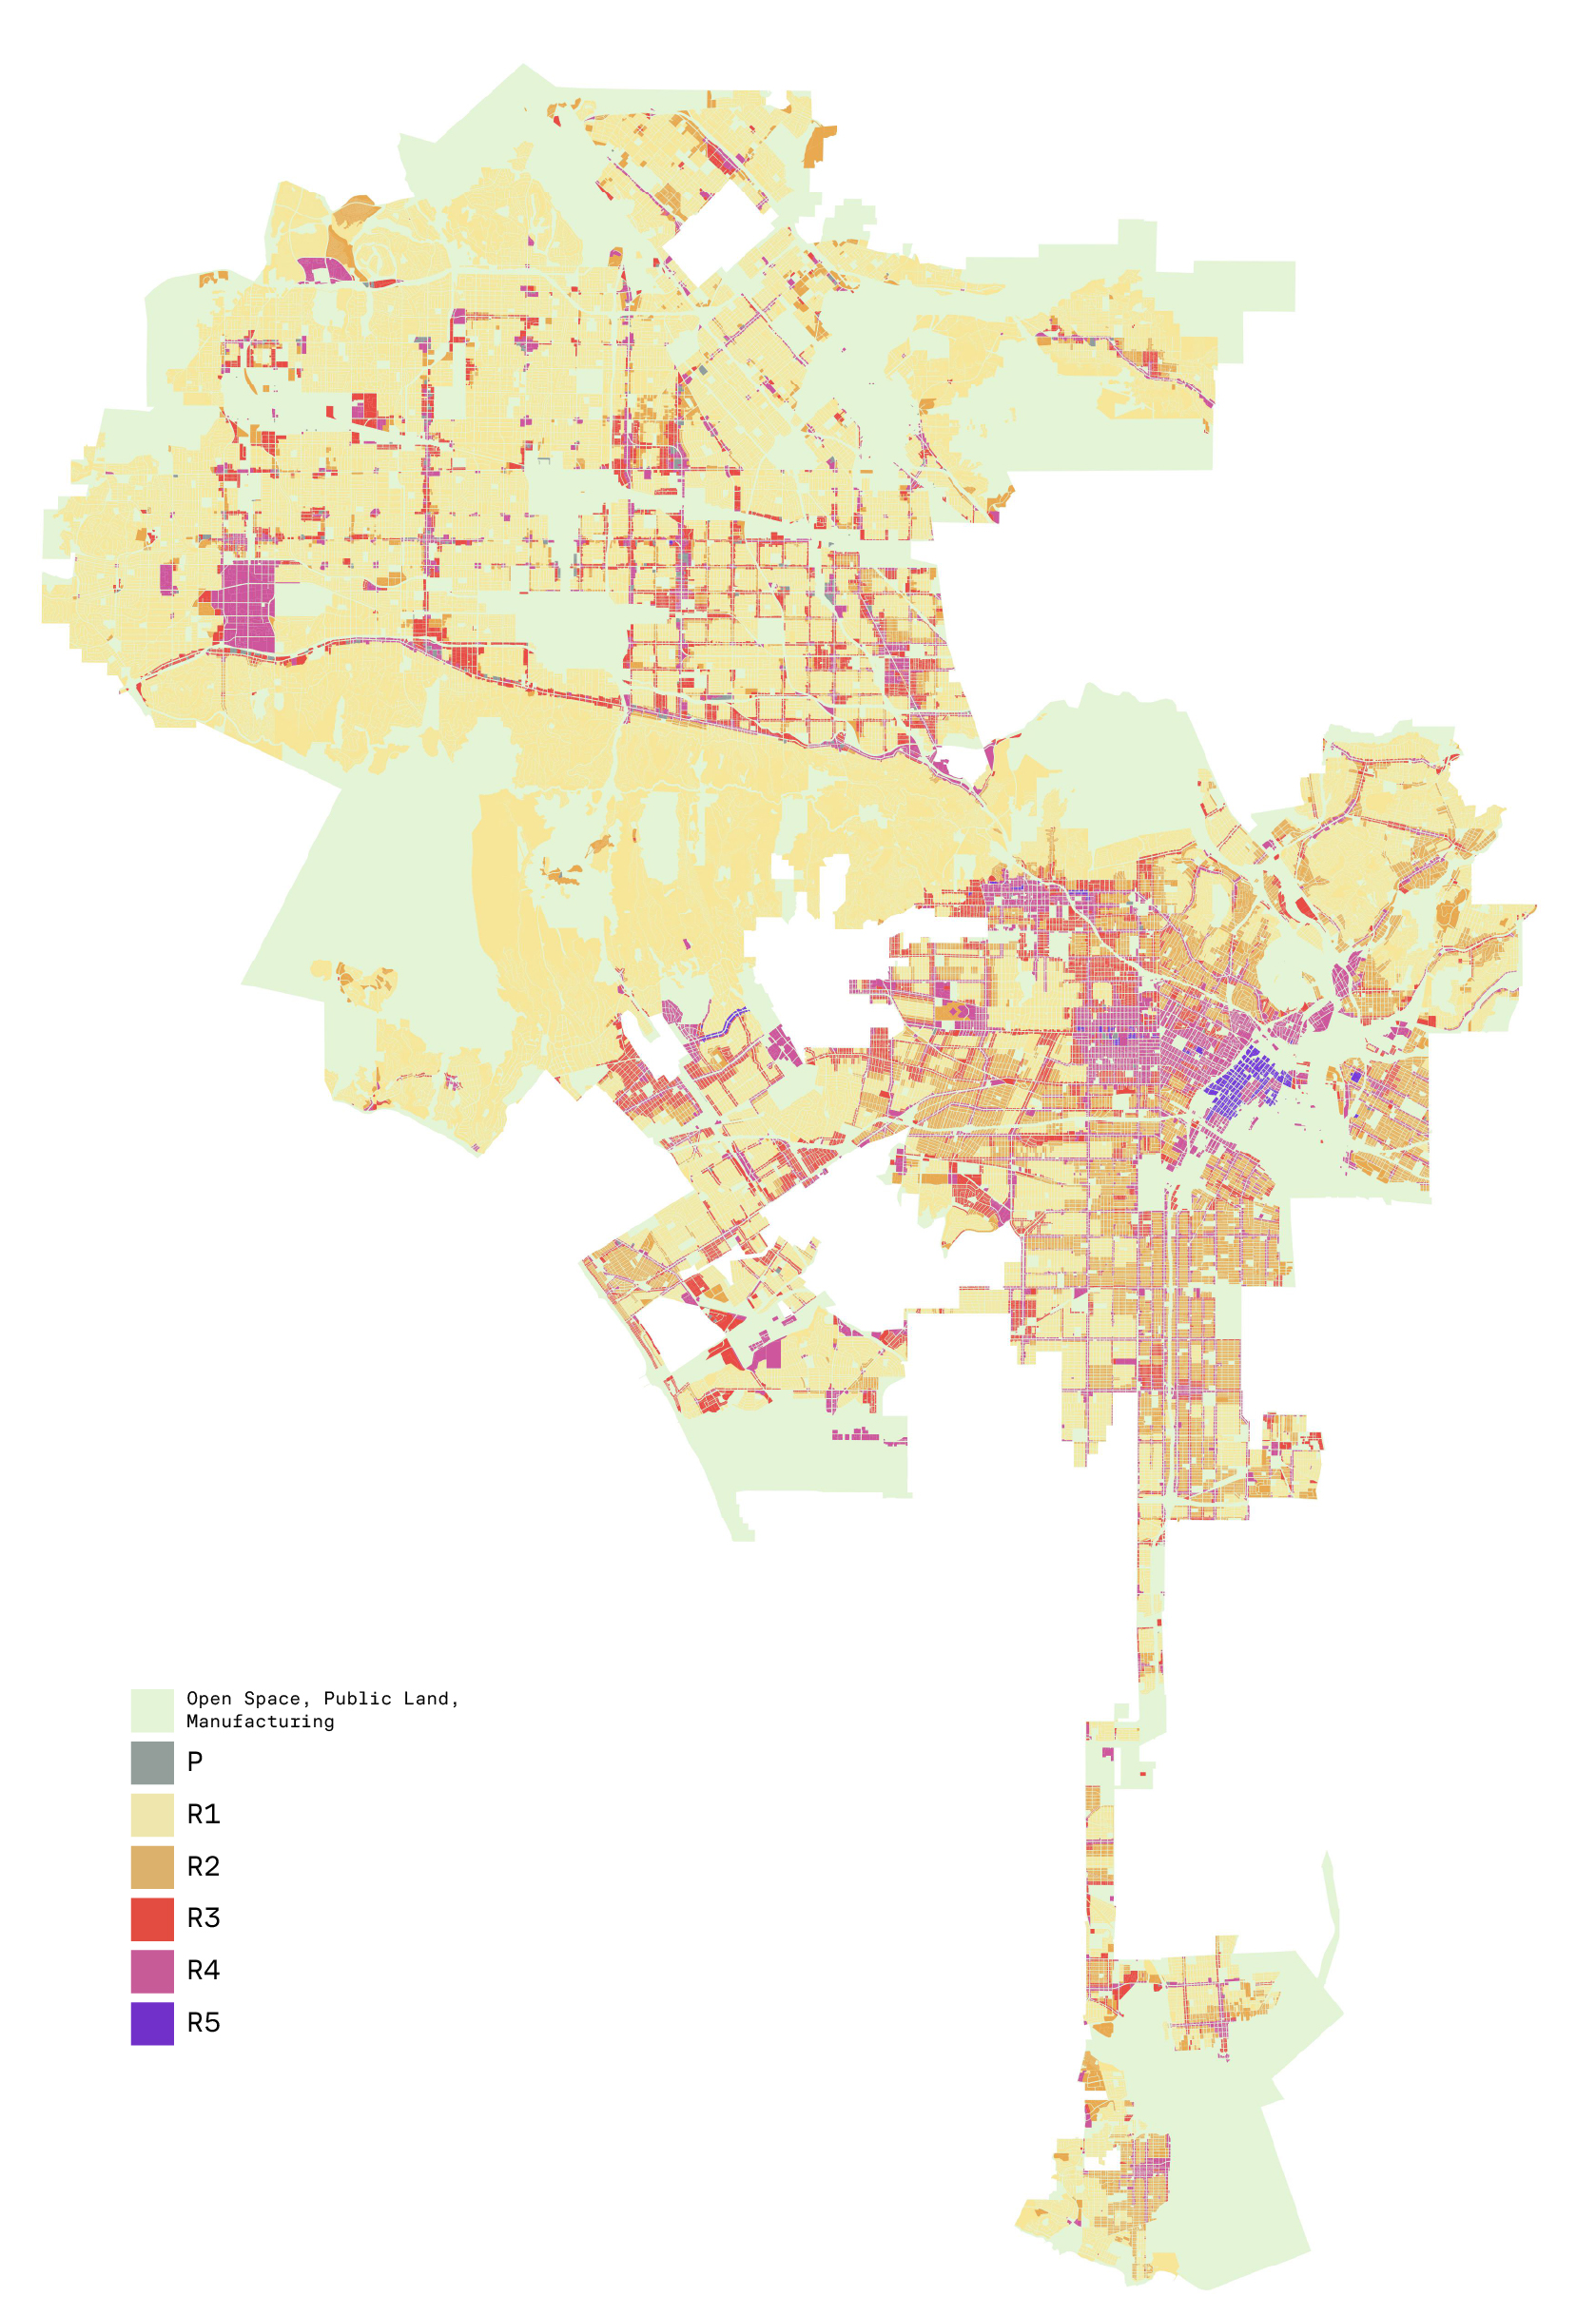
Map of simplified existing zoning categories used for our analysis
In relation to SB79 upzoning - we use R5, R4, and R3 to represent the three buckets included in the bill.
| Associated Zone | SB79 Area of Impact | SB79 Height | SB79 Density |
|---|---|---|---|
| R5 | 1/4 Mile of Tier 1 Transit Stops (Heavy Rail transit) | 75 feet | 120 units/acre |
| R4 | 1/2 Mile of Tier 1 Transit Stops (Heavy Rail transit) 1/4 Mile of Tier 2 Transit Stops (Light Rail, BRT, Frequent Commuter Rail) | 65 feet | 100 units/acre |
| R3 | 1/2 Mile of Tier 2 Transit Stops (Light Rail, BRT, Frequent Commuter Rail) | 55 feet | 80 units/acre |
These buckets aren’t fully accurate. For example in DTLA many “R5” parcels in our map clearly are taller than 75 feet - but we believe they act as a reasonable guide when it comes to property tax revenue. Because we are averaging against the wide bucket of current land use per zoning category, the average City revenue here is pulled down by underutilized lots.
In fact, comparing recent examples of redevelopment that match the building envelopes allowed under SB79 we find property tax revenue is often more than our model estimates. For example, an apartment building at 3980 Wilshire Blvd is 8 stories tall with 228 units, a reasonable proxy for what would be allowed under SB79’s most generous tier combined with state density law. This property brings in $887,527 per acre - more than two times our estimate for recent R5 parcels. By checking our model against real development we consider our analysis conservative, and the ceiling for increased property tax revenue is likely higher.
Property Taxes in Los Angeles
Like many municipalities, property taxes are the largest single contributor to the Los Angeles city budget, making up a third of the general fund. Property taxes are considered more stable than other contributors such as sales taxes which fall and rise closely with the economy.
In Los Angeles, property taxes are collected by the County Assessor. For every dollar collected inside the City of LA, about 24 cents are returned to the City budget. The rest help fund other bodies like LAUSD and the County Department of Health. In 2025 the City is expected to receive $2.8 Billion dollars.
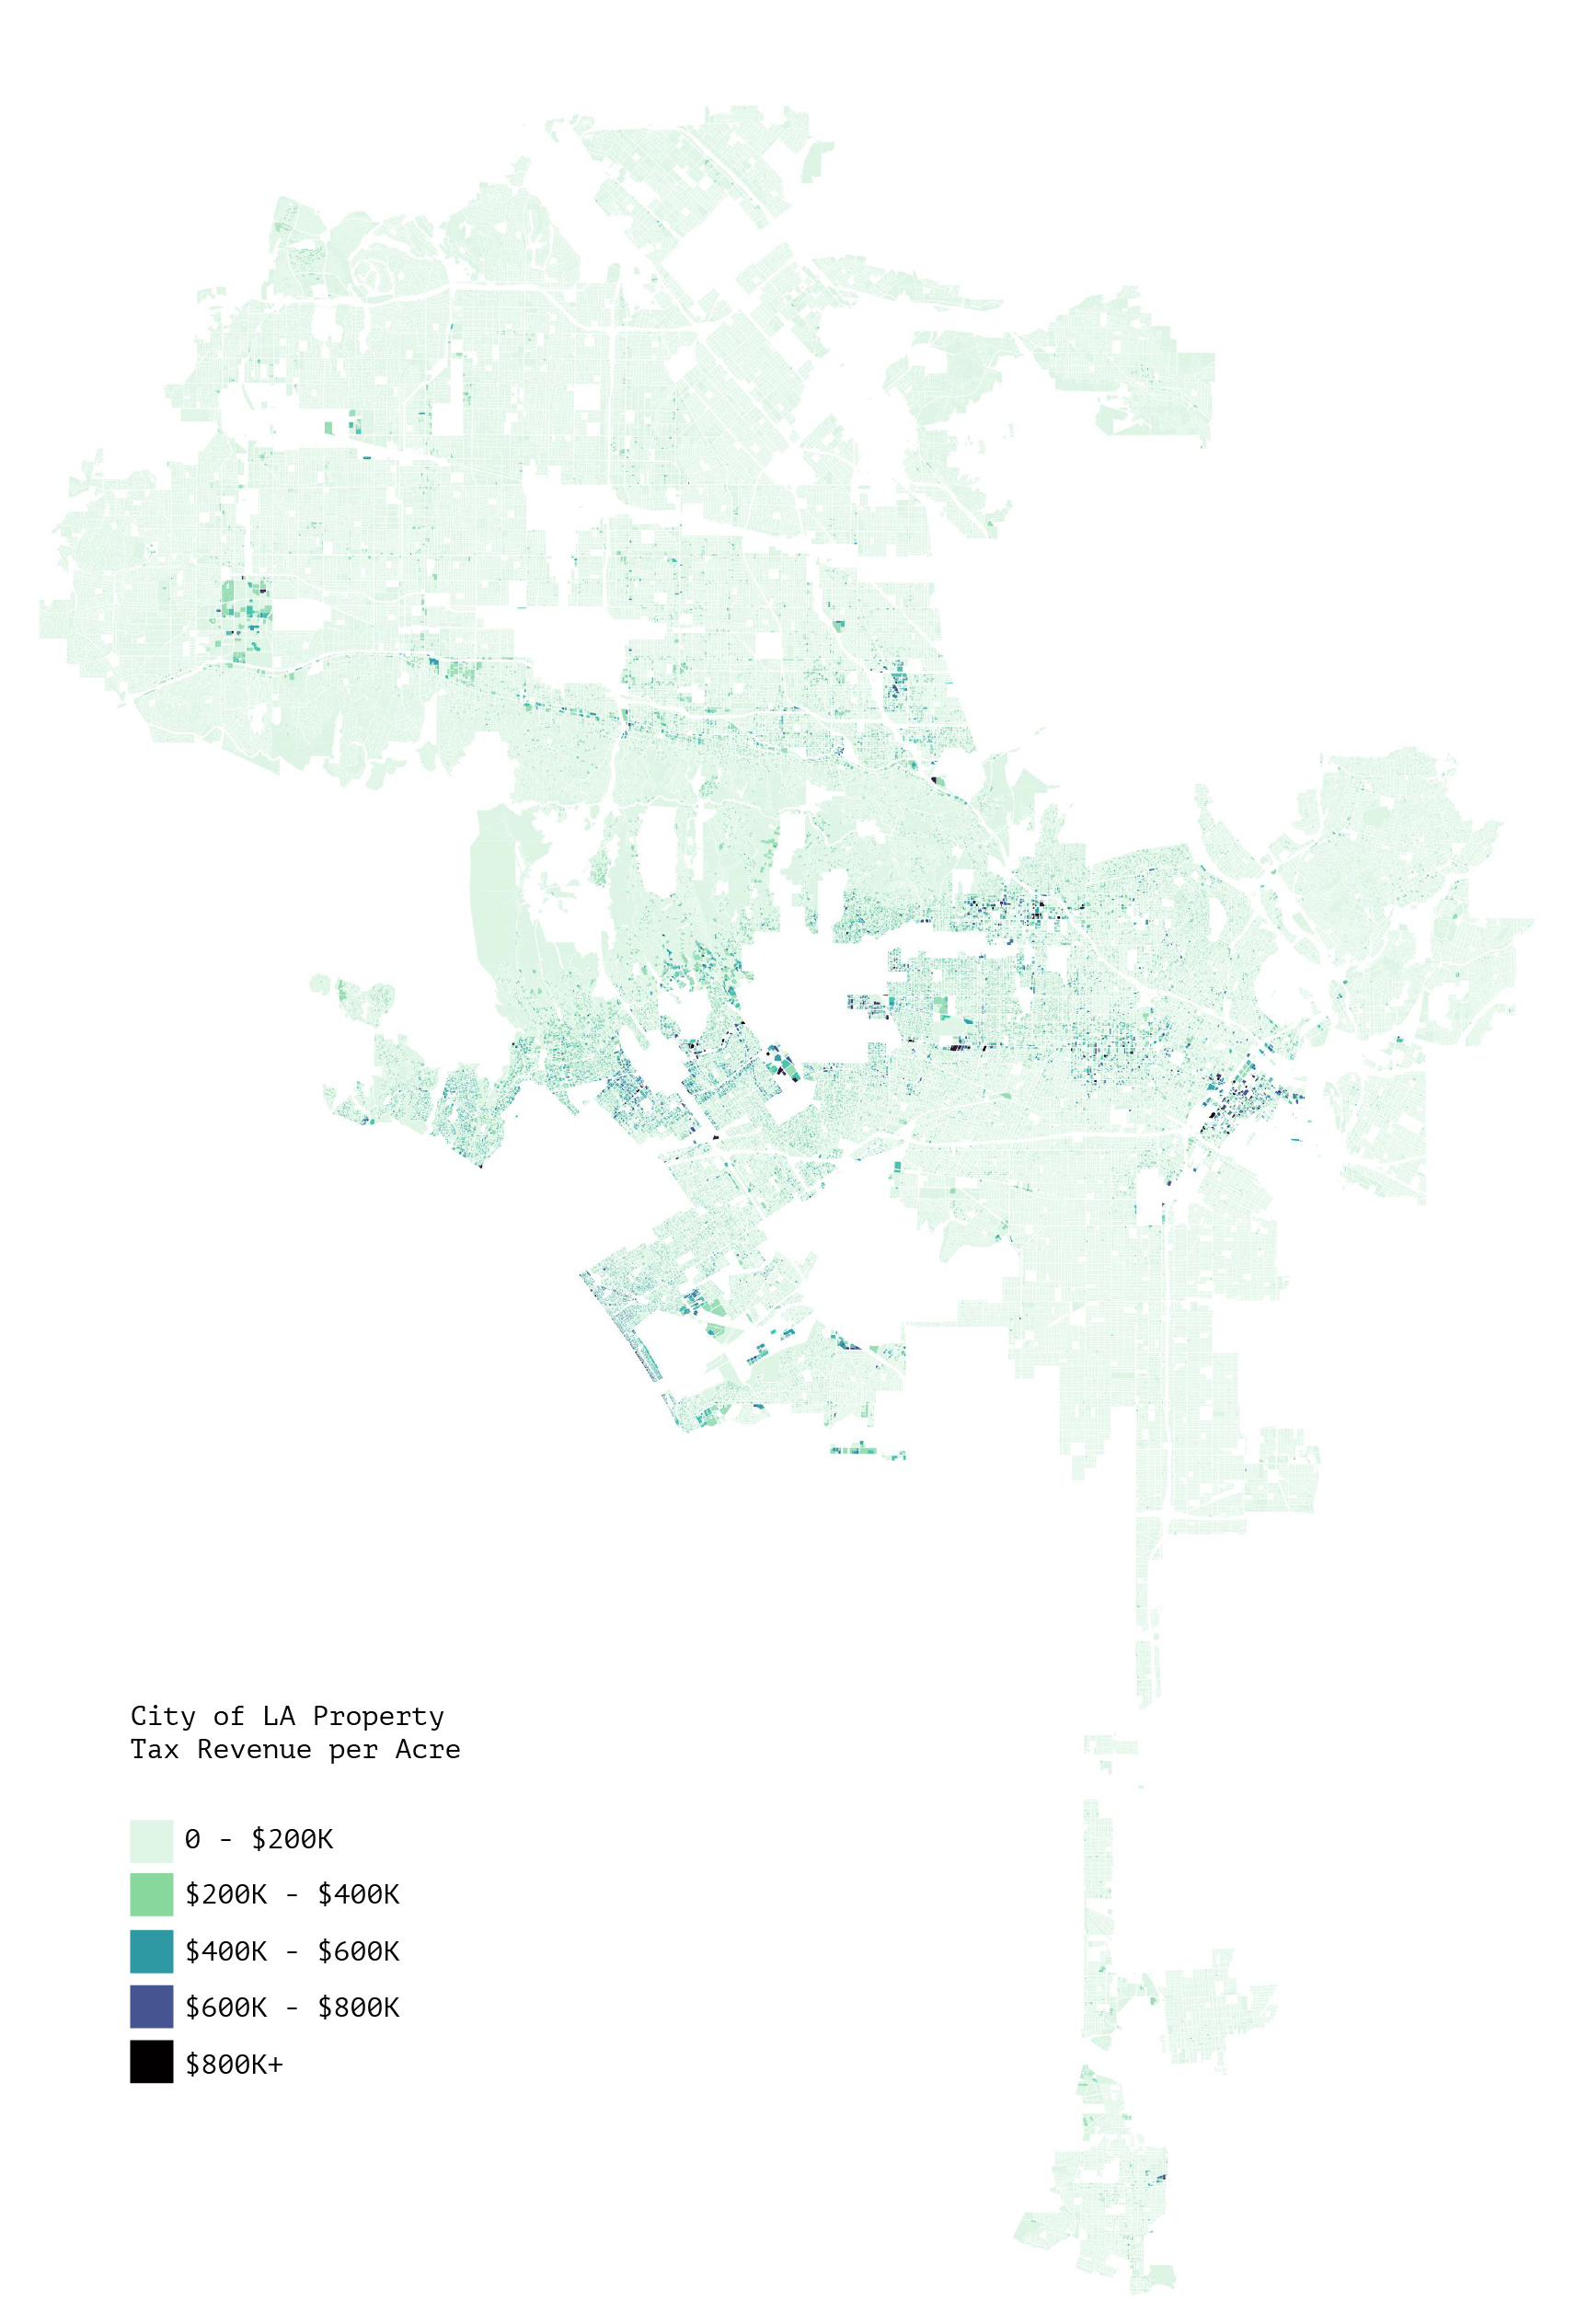
Map of property tax revenue per acre in the City of LA
A parcel is assessed based on two things, the value of the land and the value of any improvements built on top of it. Looking at a map of property tax revenue normalized by area - we see two patterns. One is a general trend of increasing property values as you get closer to the beach and Santa Monica mountains. This land is some of the most expensive real estate on earth and in high demand. The other obvious pattern is high density areas, like Downtown LA and Hollywood, have high property values because sizable improvements have been built there.
No discussion of property taxes in California is complete without explaining Prop 13. Passed in 1978, Proposition 13 limits the annual rate of assessed value increase to 2% per year unless the property is sold or significantly modified (the only time a property can be reassessed). This means there are many properties paying taxes on assessed values far below market value for their home - and that two identical properties may pay wildly different property taxes (as much as 10x). This has a spoiler effect on property turnover in California, as property owners hold onto homes to avoid the tax hike of moving.
What it means for our study is that the longer ago a property was reassessed, the less accurate it is as a benchmark for what new construction would pay. To get around this we carved out properties reassessed in the last 10 years to act as our reference to represent new development.
Generating two averages, one for all parcels of a type, and another for just recent redevelopment, shows how much Prop 13 is limiting property tax revenue. In our analysis, 76% of the value of redevelopment in SB79 parcels comes from the added value of denser housing. 24% of the value of redevelopment comes simply from properties being reassessed.
We can also analyze the ratio of improvements to land value in a parcels property tax to see things like vacant properties. We estimated the number of vacant or near vacant parcels by looking to see if the value of improvements was less than 10% of the value of the parcel’s total land plus improvement value. We found over 400 near-vacant parcels (862 acres of land) within ½ mile of major transit stops in the City of LA.
Because these lots are empty, they are likely candidates for redevelopment. Currently these parcels pay $31,598,400 in property taxes, of which the City of LA receives about $7,830,000. Under SB79 rezoning, we estimate the potential property tax revenue just from vacant lots near transit is $244,279,000. Nearly a quarter of a billion dollars.
Methodology on Modeling Property Tax Revenue
If you are interested in exploring the code, the datasets are hosted in a Github repo along with a jupyter notebook file for re-running our calculations.
The ultimate goal of this analysis is to understand the efficiency of residential and commercial parcels in generated property taxes from the perspective of zoning. By applying a coarse analysis, we aim to distill the complex landscape of zoning designations and property tax policies into a clear and accessible summary of what types of zoning are most and least efficient in terms of generating property taxes for the city, as well as produce a comparatively robust method of predicting how individual parcels’ property tax values might respond zoning changes such as in SB79.
We measure this “efficiency” as the tax per acre of the zone, where the tax is the dollars in property tax revenue received by the City of Los Angeles. Computing this metric begins with a full dataset of all the parcels in LA with individual characteristics and taxable value. This is combined with zoning and parcel geometry datasets so that we have a full set of all parcels with relevant information for the analysis. Zoning values are consolidated into R1-R5 categories based on the analysis of the zoning code by SFA’s policy team and the dataset goes through a cleaning and merging process so that all geospatial data accurately represents the parcels. We are then able to sum property values and divide by total acreage for each zoning bucket to arrive at the consolidated zone tax efficiency. We calculate two versions of this metric, one using the full dataset and another only using parcels for which the Prop 13 “Effective Year” is 2015 or later, which provides a more accurate representation of tax efficiency for recent and newly developed parcels unaffected by decades-old parcels with artificially low values due to Prop 13. Both metrics for each zone are featured in the above table associated with the interactive calculator.
The final piece of our analysis is an attempt at a more granular and accurate means of predicting property tax for an individual parcel subject to zoning changes. The interactive calculator uses the tax/acre values to coarsely model the effect of rezoning on tax revenues, a model which is agnostic of individual parcel characteristics. In order to more granularly evaluate the potential effect of SB79 on city tax revenues, we looked to develop regression models to predict tax values in each zone based on the specific parcel. We trained a slate of regression models for each zoning bucket using different selections of parcel data features and encoding methods and selected the highest performing models to employ in predicting tax changes based on SB79 rezoning.
The efficiency analysis begins with the Assessor Parcel Data, which we use for property tax and parcel information, filtered for the City of Los Angeles and relevant data features. Parcel latitude and longitude points are geocoded into a separate zoning geometry to map each parcel to its specific zoning designation. This code is broken down into relevant encoded parts, such as the zone and the high district, and that information is used to group parcels into zoning buckets R1-R5 and Parking. Also worth noting is that our analysis used an older version of the zoning code from several months ago, since recent changes had just gone into effect for downtown zoning which would not be reflected in 2024 property tax values. The land parcels geodataset is also merged into the dataset so that acreage can be calculated from parcel geometry. At this stage certain parcels are dropped from the dataset if they are not residential or commercial, and therefore would not be relevant for this analysis.
The individual parcel geometry requires some processing before it can be appropriately used in calculating tax efficiency. More specifically, parcels in areas such as condos and gated private communities are duplicated and massively inflate the total acreage of a zone. We employ a geometry merging methodology adapted from our previous work on bus delays to combine overlapping parcels and appropriately aggregate data features so that the data set is accurate to the reality of the parcels represented.
With the full parcel dataset prepared, we can finally calculate the aforementioned efficiency metrics for each zoning tier, using both the full set of parcels and the recent post-2014 data. The tax per acre metrics for post-2014 data is higher than all-time (pre- and post-2024) data for all zoning tiers by a factor of 2-3x, showing the drastic effect that Prop 13 has on property tax revenues efficiency. Prop 13 has been extensively studied for its negative impacts on housing affordability, municipal financial sustainability, social equity, and more, however for the purposes of this analysis we are mainly focused on ensuring that Prop 13 is taken into account when evaluating tax efficiency.
The initial efficiency analysis completed, the next step is attempting to build more granular models for predicting tax values for each zoning tier based on parcel data. The efficiency metric for predicting property values is ultimately a linear regression while assuming a zero intercept, so that is likely an area to improve on accuracy. We built a training pipeline to build various regression models on different mixtures and treatments of features and compare their R2 values to determine best fit among all runs for each bucket. There are only a few features appropriate to use for training for this task due to the ultimate goal of employing these models for upzoning and therefore simulating something of an “average zone redevelopment” for that parcel. If the parcel is redeveloped, we can obviously not rely on any features such as number of units, square footage, bedrooms, etc. to predict property tax revenue. Instead, our predictors are reduced to just location and geometry in the form of acreage. To encode location we experimented with using zip codes as a categorical feature as well as using latitude and longitude in their original format. The final consideration was handling the Prop 13 effect. We experimented with both the same filtering we used for efficiency calculations as well as using the full dataset but entering “parcel age” as a training feature. Instead of arbitrarily choosing a feature and encoding mix and type of regression model, we chose to train and evaluate every combination of model and feature set, including outlier trimming, to determine the best model for each zone at predicting property tax values. The entire process results are too large to include in this report, but can be viewed in the GitHub repo.
We also automated the process of selecting the best performing model for our task by forming composite scores from the R2 value, the cross validation R2 value, and the root mean squared error (RMSE). After running every model for every feature set for each zoning tier we rank each model by the three metrics, as well as by using a composite weighted score of each metric normalized. We used different weighting schemes, but ultimately chose the scheme that weights RMSE at 50%, since our downstream task is using the model for real-world prediction and error minimization is the highest priority. The table below features descriptions of the best-performing models for each zone that is relevant for upzoning.
| Zone | Sample Size | Feature Set | Model | R2 |
|---|---|---|---|---|
| R5 | 993 | Acreage, Parcel Age, Lat/Lon | Random Forest | 0.6040 |
| R4 | 37164 | Acreage, Parcel Age, Lat/Lon | Random Forest | 0.3446 |
| R3 | 105905 | Acreage, Parcel Age, Zip Code | Random Forest | 0.3805 |
A few things are worth nothing about these results. First, the R5 and P zones likely suffered in their models’ ability to fit the data due to small sample size of values with effective years after 2015. The R5 zone only has 37 samples whose Prop 13 relevant year is 2015 or later and the Parking zone has only 90. The performance of these models is then intuitively better when using a larger sample size by not filtering the data and then using the Parcel Age as a predictor, however this still means a much larger variance in property tax values. Second, the standout performance of Random Forest across the plurality of zones is appropriate given the use of latitude and longitude as an input. Tree-based regression models are able to break down these location values into useful groups instead of relying on categorical zip codes, which may be more arbitrary in terms of property values.
With the best-performing models prepared, the final step of the analysis is to apply the models to parcels affected by SB79 and compare the predicted gain in property taxes to the gains based on efficiency. To determine those parcels, we use a dataset of transit stops affected by SB79 and their associated “tier” and create catchment filters to mark the relevant parcels and determine their new zoning value. Then each model can be applied to the parcel for its new SB79 zoning and the predicted property tax values can be summed and compared to the efficiency-based calculations. These results are below:
| Zone | Tax/Acre Gain | Regression Model Gain | Percent Difference |
|---|---|---|---|
| R5 | $548,586,054.24 | $321,680,788.81 | 41.36% |
| R4 | $331,510,209.64 | $345,812,085.54 | -4.31% |
| R3 | $147,972,425.02 | $190,151,280.08 | -28.50% |
| Total: | $1,028,068,688.89 | $857,644,154.43 | 16.58% |
It is worth noting that these tax gain figures assume that all rezoned parcels are redeveloped to their most likely level given their new zone and individual size and location. Full redevelopment is not realistic, which is why the above tax increase calculator allows that level to be adjusted, but for the purposes of comparing the models to the efficiency metrics we apply the same redevelopment level to both.
Our set of regression models certainly represents a more robust and accurate approach of estimating upzoned property tax values which makes fewer assumptions about contributing factors to property tax values, however ultimately the difference in predicted gain due to SB79 for both methods is only about 5%. The tax per acre method is useful for evaluating efficiency and presenting interactive and accessible tools such as the above calculator while the regression method is more accurate at predicting potential changes to specific parcels as well as validating the tax per acre method. Both methods remain coarse and high-level. Redevelopment potential is crucial in accurately estimating which parcels would see increases in property taxes and it is determined by a myriad of complex factors beyond simply rezoning such as financial feasibility, permitting,